• 287 days Will The ECB Continue To Hike Rates?
  • 287 days Forbes: Aramco Remains Largest Company In The Middle East
  • 289 days Caltech Scientists Succesfully Beam Back Solar Power From Space
  • 689 days Could Crypto Overtake Traditional Investment?
  • 694 days Americans Still Quitting Jobs At Record Pace
  • 696 days FinTech Startups Tapping VC Money for ‘Immigrant Banking’
  • 699 days Is The Dollar Too Strong?
  • 699 days Big Tech Disappoints Investors on Earnings Calls
  • 700 days Fear And Celebration On Twitter as Musk Takes The Reins
  • 702 days China Is Quietly Trying To Distance Itself From Russia
  • 702 days Tech and Internet Giants’ Earnings In Focus After Netflix’s Stinker
  • 706 days Crypto Investors Won Big In 2021
  • 706 days The ‘Metaverse’ Economy Could be Worth $13 Trillion By 2030
  • 707 days Food Prices Are Skyrocketing As Putin’s War Persists
  • 709 days Pentagon Resignations Illustrate Our ‘Commercial’ Defense Dilemma
  • 710 days US Banks Shrug off Nearly $15 Billion In Russian Write-Offs
  • 713 days Cannabis Stocks in Holding Pattern Despite Positive Momentum
  • 714 days Is Musk A Bastion Of Free Speech Or Will His Absolutist Stance Backfire?
  • 714 days Two ETFs That Could Hedge Against Extreme Market Volatility
  • 716 days Are NFTs About To Take Over Gaming?
How Millennials Are Reshaping Real Estate

How Millennials Are Reshaping Real Estate

The real estate market is…

Tesla Struggles To Compete In European Market

Tesla Struggles To Compete In European Market

Tesla continues to catch the…

  1. Home
  2. Markets
  3. Other

Gold's Critical Junction Has Arrived

First, if you are a Standard or Advanced subscriber and have not logged in yet, please login immediately.

Today Update for Free Subscribers is below:

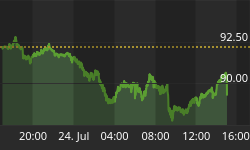
Today, we will look at what is happening to Gold on the GLD (ETF). Today's 1 year chart shows the three basic up moves that GLD has had during the past year.

GLD is once again coming to a critical area where it needs to decide if it will break out and run to new highs, or if it will stay within its expanding wedge trading range and drop 10+ points.

If you look at today's line chart, you can see that GLD is getting squeezed in between a resistance line and a rising support line. The resistance line is of special interest because it is making a triple top. As it makes this triple top, the zero based RSI is showing that each resistance line test has been occurring with less and less strength.

What happens next is pretty straight forward ... if the RSI breaks above the resistance line, then GLD will blast through its triple top resistance. If the GLD falls below its support line (see the red circle on the chart), then GLD will be facing the prospect of falling approximately 8%.

Free Gold


(Not a subscriber yet? Give some thought to joining us and see the dozens of chart updates we post daily. Charts that include inflowing Liquidity levels, Institutional Investor Buying and Selling levels, Institutional Accumulation/Distribution and data not found anywhere else.)


Back to homepage

Leave a comment

Leave a comment