


Based on the April 15th, 2011 Premium Update. Visit our archives for more gold & silver analysis.
Gold market witnessed a bumpy roller coaster ride during the week. An interesting thing to observe was the reasons that economic commentators gave for price fluctuations. On Tuesday gold for June delivery lost $14.50 to settle at $1,453.60 an ounce at the Comex division of the New York Mercantile Exchange. The gold price has traded as high as $1,468.50 and as low as $1,445 while the spot gold price was shedding more than $11. The reasons for the decline were explained by falling oil prices and by a Goldman Sachs report with a short-term bearish call on oil and copper, the industrial bellwethers. (The term "bellwether" refers to the practice of placing a bell around the neck of a castrated ram leading his flock of sheep so that the movements of the flock could be noted by hearing the bell).
Precious metals were particularly hard hit by the Goldman-induced selling even though they were not - platinum aside - directly mentioned in the note. Silver had hit a 31-year high of $41.93 an ounce but fell back at one point to $39.75, a 5.2 per cent reversal. The explanation for this in Bloomberg is that an investor took an outsized option bet that SLV will drop 37% by July. Bloomberg reports: "A trader's almost $1 million bet that an exchange-traded fund tracking silver will plunge 37 percent by July was today's biggest single options trade on U.S. exchanges as futures on the metal reached a 31-year high. The 100,000 options to buy 100 shares each of the iShares Silver Trust (SLV) at $25 by July changed hands at the ask price of about 10 cents and exceeded the open interest of 6,054 outstanding contracts before today, indicating that a buyer of a new bearish position initiated the transaction. The ETF rose to the highest intraday level since trading began five years ago, $40.33, before erasing gains. It fell 0.5 percent to $39.67 at 12:54 p.m. It hasn't closed below $25 since November."
On Wednesday, gold rose recovering after its biggest one-day drop in nearly a month. The explanation for the upward move was that the dollar retreated amid expectations the US Federal Reserve will maintain its accommodative monetary policy for now. Also, the market reacted to the positive industry report issued by metals consultancy GFMS group saying that gold's decade-long price rally could take the metal above $1,600 an ounce by year-end, as investors' appetite for gold sharpens further (notice the food metaphor.) The company sees gold prices averaging $1,455 an ounce this year and sticking to a range of $1,319-1,620 an ounce. In its Gold Survey 2011, metals consultancy GFMS said there was growing evidence that buyers may drive prices still higher this year. "There is a higher starting point for each successive investor-led rally in the price. Thus, assuming investment demand will at some point take off again this year, there remains good scope for new highs in the price to be recorded," the consulting group said.
Thursday morning when gold futures began climbing some analysts attributed it to weakness in the U.S. dollar, the euro and sovereign debt issues in Europe.
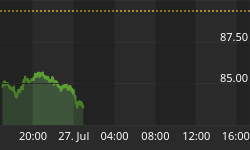
When on Friday Gold jumped to another record high to $1,479.70 an ounce on Globex, after settling at $1,472.40 on the Comex division of the New York Mercantile Exchange analysts said it was inflation fears in China that are pushing gold and silver prices higher. China's inflation jumped to a 32-month high. Another reason given for gold's performance was a softer U.S. dollar. We will have more to say on the latter relationship in the following part of this update.
We don't know if next week investors will get their risk appetite back. While markets are not focusing on geopolitical risk in Africa and the Middle East and the Japanese natural and nuclear disasters, these problems remain and will lead to continuing safe haven demand.
We turn to the technical portion to give you some food for thought. Actually we have only two charts for you this week (the full version of this report includes 17 of them), but both have important implications (charts courtesy by http://stockcharts.com.)

Beginning with the short-term GLD ETF chart, we observe that it signals a bullish trend in gold market. The very bullish reverse head and shoulders pattern which was formed over the December to April period has indeed been verified.
Price levels have recently moved above the neck portion in the pattern and this move has been verified. Furthermore, the move was accompanied by strong volume, followed by a short consolidation, a decline back to the neck level and a quick reversal and a subsequent rally on significant volume. Simply put, this is both classic and beautiful, a true textbook verification of a breakout.
The situation is clearly bullish in the short term. Meanwhile, let's see what happens in silver market - in this case from a long-term perspective and through the oil perspective.

We now present an updated version of a chart which we discussed in the March 11th Crude Oil, Gold, and Silver - Important Timing Connection. We were asked at that time to analyze oil and the ratios between oil, gold and silver. We found only one point of interest that being a possible cup and handle pattern in the silver to oil ratio. This pattern now appears to have completed and the ratio has broken out to the upside. If this breakout holds, it is possible that it will have profound implications for silver investors. In fact, it would imply that silver will actually heavily outperform oil from an investment standpoint.
Decreases in the price of oil would not appear likely to greatly impact the price of silver if the breakout in this ratio is confirmed. Also, if oil prices rise or even stagnate, silver investors will still likely benefit. This is indeed very positive news for those investing in the white metal.
Summing up, the short-term signs appear bullish for precious metals market. This sentiment is supported in several key charts and at this time. It is difficult not to be excited about the outlook for silver today. Its performance in recent months certainly has not been a fluke and it appears that further price increases are likely for the white metal.
To make sure that you are notified once the new features are implemented, and get immediate access to my free thoughts on the market, including information not available publicly, we urge you to sign up for our free e-mail list. Gold & Silver Investors should definitely join us today and additionally get free, 7-day access to the Premium Sections on our website, including valuable tools and unique charts. It's free and you may unsubscribe at any time.
Thank you for reading. Have a great and profitable week!


