


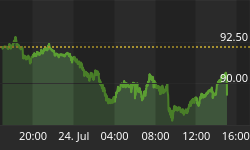


S&P 500 Analysis for week of 4/18/11
Current Primary Trend: Bull Signal - Initiated Sept. 13th
The Primary Trend chart determines our long term market strategy of being long or in cash. The PT is the primary trend. Once the medium term trend is in the same direction as the PT chart we then enter the market. Short-term information should assist in your execution of trades. Take the emotion out of your investment decisions. Implementing a trend-following crossover strategy - has no guess work, no sophisticated technical analysis, and no judgement.
Trend Model

Short-Term Trend: (time frame - days to weeks) - 13 day Force Index & ROC change with EMA crossover confirmation
Medium-Term Trend: (time frame - weeks to months) - 5 day above/below 35 ema - Determines timing: exits, entries and re-entry. Use in correlation with the PSTS overall primary trend. Bottom 3 indicators can sometimes give a heads up.
Primary Trend: (time frame - months to years ) Less cautious investors can purchase back in when the slow scholastics moves above the 20 with the MACD above the 9 week average. Conservative investors can get out when the ADX, Force and MACD turn negative before the EMA crosses.
We feel the S&P 500 data gives the broader view of the market.
- NASDAQ usually leads both the up and down market trends.
- Its estimated that 70% of trades are done by High Frequency platforms. Total volume of the NYSE consist of about 28% of the total market volume with around 85% of the NYSE being institutional volume. The NYSE still has the largest institutional investor up/down volumes and should provide a hint at the big institutions buying and selling. (volume accumulation/distribution)
- Indices Summary Charts
Risk-Reward Advisor
MARKET CORE STRENGTH INDEX (MCSI)
Week of 4/18/2011 - version1.07 (word doc)

14/30 - 47%
- bullish zone: 21-30 - 70%
- caution zone: 10 to 20
- danger zone: 0 to 9 - 30%
MCSI: Within the context of the current uptrend, market conditions shows that caution is indicated - Market breadth, price and momentum indicators show considerable weakness. Support and trend levels are all very closely bunched. Big days up or down can change the outlook very quickly.
- Primary Long-Term Trend: Bull
- Intermediate-Term Trend: Bull - Outlook is favorable.
- Short-term Trend: Bearish - Showing fatigue, slight down trend.
Opinion: Trend model shows the short-term outlook still has difficulties rising above resistance. With the MCSI showing major weakness, if the market deteriorates further it could turn the short-term trend very bearish and intermediate trend neutral to a bearish sentiment. S&P500 support ~1289 level then 1249. S&P resistance 1336 (close above resistance would complete a bullish inverse head-and-shoulders) We wait for what the house deals for a hand next week, & see if the odds increase or decrease.
Comments: RISK management is the hallmark of of a successful portfolio. Markets were in consolidation to down the past week. If you haven't properly raised some cash to preserve your capital, this may be another chance to do so. VIX Fear Index fell below its 7-week range on 4/15/11, hitting 15.03 intraday, and again confirming a return to bullish complacency in strong uptrends. VIX of 16-18 which can be a contrarian indicator near extremes and can sometimes indicate a pullback or market top. Some say because of POMO that the VIX indicator doesn't work as well and should be ignored?
Bull vs. Bear
- The four-year presidential cycle.
- Seasonality: buy in the fall go away in May.
- Length of current Bull Market indicates it is overdue for correction
- POMO: ends June 30th.
Some market valuation models indicate stocks are over priced - Goldmans Call on commodities
- U.S. & European sovereign debt crisis
- Signs of inflation are unmistakable-this cant be good news for the stock or bond market.
- DayTrend
- Commentary
- Observation
Some traders also think the market can't go further without the financials BKX.
The reason is because the Financial sector makes up 15.81% of the S&P 500. The banks obviously play an important part in the economy due to their necessary lending functions. per stocktiming.com
Meant only for educational purposes only: Use as a broad guide according to your risk management practices. All indicators are lagging.
The core strength index includes 18 support indicators. Closing Friday market data of individual indicators is used to analyze support for the following week. The supporting data show support of the current trends' internal strengths. View this information as a check up of the markets current condition. Seeking to diagnose general or specific risks that may affect Mr. Markets health. Daily data can be taken from our links or can be viewed from MarketVolume.com. Total score of the index will be posted along with its' sentiment rating. The core indicators are rated individually and as group sentiment rating (Bullish,Bearish).
Both the Trend Model and the Core Strength Index Model are based on how the markets operate. It has nothing to do with what anyone "thinks” is going to happen, nor is it based on someone's interpretation of the fundamentals. But remember, that just like playing poker this system is an odds based program. You need to respect that the markets can do anything at anytime, even when you think you may have an edge. Per Kenny Rogers - You got to know when to holdem, know when to fold 'em, Know when to walk away'. (SPX has only fallen 6.4% since its latest interim high. March was a minor selloff, well below the 10% threshold that defines a full-blown correction.)
Price leads the market - sometimes the Trend Model may be more bullish then the Core Index Model - giving the green light for the higher risk trade. The more cautious investor may want to wait till the Core Index breadth indicators turn positive for more market strength. Momentum indicators primary purpose is to identify 'buy the dip' opportunities in a bull market and 'sell the rally' opportunities in a bear market. Our personal opinion is to be out of the markets except your very long positions (convertibles, high yield corporate bonds, & blue chip yielding stocks with very low price points you may want to hold), once the index hits the danger zone.
Interpretation of the data for the condition indicator in our opinion, can even be somewhat subjective. We only assess market technical indicators. Fundamental indicators are not taken into account, each investor should be aware how they affect the market. Investor sentiment polls are not included in our indicators. Short, long term economic news and other factors do affect the market. Sometimes this is already baked into the market prices and sometimes it may be more of an opinion or forecast of possibles. The more subjective analysis is left up to each reader. Here is a good summary and start.
Goals:
1. Provide a free long term market signal & Trend Model. To identify major bull and bear markets/trends.
2. Provide an ongoing development in an objective market scoring system that provides investor guidance. (MCSI) To identify market conditions where the risks of market corrections are elevated, that all bull markets eventually experience. To identify improvements or return to healthy market conditions in market corrections and bear markets. We believe investors should actively manage risk. This may not be appropriate for all investors, based on their individual goals and risk tolerance. The basic concept of attempting to identify periods of elevated risk can be helpful to those investors that do want to reduce a certain amount of exposure to risk.
For more go to page 2


