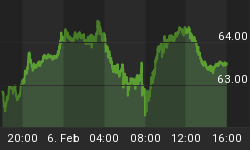
The closely-watched smoothed growth rate of the ECRI Weekly Leading Index (WLI) for the week ended 29 April came in at 6.7% or 0.8% lower than the previous week.

Source: Dismal Scientist.
In previous articles I argued that the S&P 500 index is perhaps the most important constituent of the ECRI WLI, as evidenced in the graph below, where my calculated smoothed growth rate for the S&P 500 is plotted against that of the ECRI WLI.

Sources: Dismal Scientist; I-Net Bridge; Plexus
Closer examination indicates that the S&P 500's smoothed annualized growth ticked up last week.

Sources: Dismal Scientist; I-Net Bridge; Plexus Asset Management.
The smoothed annualized growth rate of the yield in the US 10-year government bond note is also one of the constituents of the WLI.

Sources: Dismal Scientist; I-Net Bridge; Plexus Asset Management.
From the following graph it is evident to me that the growth rate of the 10-year yield has dropped slightly, exerting some downward pressure on the WLI in the past week.

Sources: Dismal Scientist; I-Net Bridge; Plexus Asset Management.
Materials is a known constituent of the ECRI WLI. As a proxy for materials, I use the Economist Metals index.

Sources: Dismal Scientist; I-Net Bridge; Plexus Asset Management.
The smoothed annualized growth rate of the Economist Metals index continued to slide last week and has therefore also exerted downward pressure on the WLI.

Sources: Dismal Scientist; I-Net Bridge; Plexus Asset Management.
I have identified initial jobless claims as another constituent of the ECRI WLI. Please note that the axis displaying the smoothed annualized growth rate of initial jobless claims is in reverse order, because positive growth indicates a negative impact on the economy, while negative growth is positive for the economy.

Sources: Dismal Scientist; I-Net Bridge; Plexus Asset Management.
The initial jobless claims figure for the week ended 30 April was shocking as claims spiked to 474 000 from an upwardly revised 429 000 the previous week. I am of the opinion that the jobless claims figure included in the previous week's WLI was probably a significantly lower estimate than the actual one. I will therefore not be surprised if the previous week's 6.7% growth rate of the WLI is adjusted downwards. It is clear that the significantly weaker smoothed annualized growth rate of initial jobless claims has added to further downward pressure on WLI growth.

Sources: Dismal Scientist; FRED; Plexus Asset Management.
It seem to me that the smoothed annualized growth rate of the ECRI WLI for the first week of May is likely be either unchanged or lower than the to-be-lowered growth rate of the previous week, because the negative impact of the bond yield, metals and initial jobless claims is likely to overshadow the positive impact of the US equity market.
Yes, you may ask about the outlook for the ECRI WLI. Well, in that I am guided by the outlook for equity prices as I believe that they by far carry the most weight in the WLI.
But why is the S&P 500 so important as an economic indicator? I think the relationship between equity prices and the job market, as reflected by the smoothed growth rate of initial jobless claims, explains it.

Sources: I-Net; FRED; Plexus Asset Management.
I looked at different scenarios to calculate the future smoothed annualized growth rate of the S&P 500. The current level of the S&P 500 was assumed to be 1346 and I kept it constant at:
- 5% lower
- Unchanged
- 5% higher
- 10% higher.
This is how it pans out:

Sources: I-Net; Dismal Scientist; Plexus Asset Management.
It is evident that the smoothed annualized growth rates have in all cases peaked earlier this year if it is assumed that the S&P 500 remains unchanged or goes lower. In the event of the market rallying in the short term and remaining constant thereafter, the growth rate is likely to peak at the end of June this year. Another important observation is that in the case of the S&P500, 10% lower from the current levels its smoothed annualized growth rate will turn negative as early as the end of June this year. In that case and if the smoothed annualized growth rate of the ECRI WLI follows suit, it may indicate that the US will find itself in a recession in the second quarter of next year given the historical average lead of 10 months at business cycle peaks.
But just what is the relationship between the ECRI WLI and the economy? I think it is self-explanatory. In fact, the WLI is not really a leading indicator and more of a coinciding indicator of the US economy if the ISM GDP-weighted PMI is seen as a reflection of the current state of the economy. What it shows is that the market (at least since January 2006) is most of the times correct in its assessment of US economic conditions. What is certain, though, is that whenever the ISM Composite PMI finds itself on the brink of contraction, the extreme nervousness is reflected in the WLI. It also explains to what extent the markets can overreact on the upside compared to the state of the underlying economy, as seen in the latter half of 2009 and the necessary reaction to normality in the third quarter of 2010.

Sources: ISM; Dismal Scientist: Plexus Asset Management.
With the increasing number of black swans in the global pond and a significantly weaker ISM Composite, does this mean that the upward leg of the current business cycle will come to an abrupt end? I have no doubt that the markets will lead the way in answering that question.
Did you enjoy this post? If so, click here to subscribe to updates to Investment Postcards from Cape Town by e-mail.


