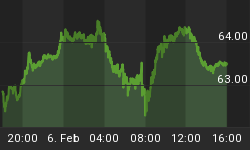
The RMS index (Morgan Stanley Reit) appears to be approaching a top in wave V of (V), but there are two other possibilities at this juncture.
1: The index could move higher towards the 800 area if the current move in wave (V) is wave (3) of wave V up.
2: There is a possibility of a larger corrective wave (IV) pattern with a pullback to the 500-650 area before another rally in wave (V) up.

The second chart is a closeup of wave (V) with 5 waves completing now, but the length of wave III is smaller than wave I. This is still valid as long as wave V ends before moving higher than 730. If we see a move higher than 720, then it is likely that wave III is still in play. A move higher than 730 would confirm this possibility.
The third chart below indicates that wave IV may be in play now, with sideways action to the downside to follow. Once wave IV completes, we should see another move higher in wave V to complete the move up. This count has a better look for wave III and is the likely path for the index.

Elliott Wave Chart Site - IntraDay Market Updates on the DOW, Nasdaq, S&P500 and HUI. To learn more on the status of Gold, Silver, HUI, XAU, and the USD, please visit the link for registration details - Registration Details.
The commentary and forecasts are updated daily, including intraday commentary and chart updates. Fibonacci pivot dates and cycle analysis is also included. The indices covered are the NASDAQ, DOW, S&P 500, Gold, Silver, HUI and the XAU. Additional charts cover the Nikkei, US Dollar (USD), 10 Year Treasury Note (TNX), IBM, Nortel, Microsoft, Ballard Power, Celestica, ATI Technologies, Biovail, Bema Gold, Newmont Mining and Agnico Eagle Mines.
Happy Trading!!!


