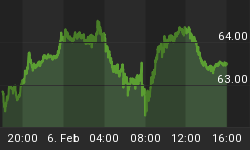
The 12-month cumulative total of net federal outlays in June 2011 was up 3.28% from the 12-month cumulative total in June 2010. From December 1955 through June 2011, the median change in the 12-month cumulative total of net federal outlays from year-ago month has been 6.64%.

Social Security's Impact on the Federal Budget Deficit
For a number of years, net contributions to Social Security exceeded benefit payments. These surpluses were transferred to the Treasury's general fund in exchange for an IOU from the Treasury to be called at a time when the net contributions to Social Security became less than the benefit payments. That time arrived in 2009 when net contributions were $8.2 billion less than benefit payments. As large numbers of baby boomers become eligible for Social Security benefits in the coming years, the shortfall of net contributions to benefit payments will widen. Thus, the Social Security Trust Fund will be its IOUs on the Treasury. In order to honor these IOUs, the Treasury will have to increase income and other taxes, issue new Treasury debt, or cut other federal expenditures. In the coming years, then, if not currently, the Social Security program will have an impact an important impact on federal budgetary decisions.

Pushing Treasury Default Beyond August 2
If the federal debt ceiling were not raised by August 2, there still would be temporary means for the Treasury to keep paying all of its bills for a while. The Treasury could pull an FDR and revalue its gold holdings. Currently, the Treasury is valuing its gold holdings at $42.22 an ounce. By revaluing its gold holdings near the current open-market price, say at $1,575 an ounce, the value of Treasury gold holdings would rise by $400.8 billion. The Fed could write up the Treasury's deposit account by that much and the bills could be paid for a bit longer even without an increase in the debt ceiling.
A Treasury Default Would Cause the Treasury's Borrowing Rate to Rise, but Why Mine?
If the debt ceiling were not increased, the Treasury's gold holdings were not revalued and the Treasury were not able to pay all of its bills, then I would expect the yields on Treasury securities to rise as the credit-worthiness of the U.S. government would have been besmirched. But I am not defaulting on my debt. Why should the interest rates on borrowing I might be seeking rise?
June Consumer Price Index - Lower Energy Prices Account for Decline, Upward Trend of Core CPI Could be Reversed if Economic Growth Falters
The Consumer Price Index (CPI) fell 0.2% in June vs. a 0.2% increase in the prior month. The 6.8% drop of the gasoline price index accounted for a large part of the decline in the headline number. The food price index moved up 0.2% in June, the smallest increase for the year. The core CPI, which excludes food and energy, rose 0.3% in June, matching the gain posted in May.

Prices indexes of new vehicles (+0.2%), used cars and trucks (+ 1.7%), apparel (+1.4%), shelter (+0.2%), and medical care (+0.2%) moved up to raise the overall core CPI. Lower airfares (-3.0%) and recreation costs (-0.1%) were partial offsets.
The 1.6% year-to-year increase of the core CPI is approaching the tolerance level of the FOMC with regard to core inflation. A large part of the gradual upward trend has occurred in the first six months of this year. Price indexes of shelter (+1.2% yoy), medical care (+2.9% yoy) and new vehicles (4.0% yoy) account for most of these gains. However, the Cleveland Trimmed-Mean CPI shows a small amount of deceleration (see Chart 4). Also, inflation expectations for the medium term are well-behaved (see Chart 5). The elevated unemployment rate and moderate projections for growth in the second-half of the year imply that economic growth is likely to get the upper hand in the inflation-growth debate at the FOMC in the near term. Moreover, if economic growth falters, the upward trend of the core CPI could be reversed. Therefore, it is premature to expect a tightening of monetary policy; the Fed is on hold in 2011.


Factory Production Decelerating Even After Excluding Autos
Industrial production moved up 0.1% in June, following two consecutive monthly declines. Supply chain problems from the Japanese natural disaster led to a decline in auto production in each of the three months of the second quarter. Production at the nation's utilities rose 0.9% in June following a 2.0% drop in May. Manufacturing output, which excludes utilities and mining components, rose 0.1% in June after holding steady in the prior month. (The manufacturing component accounts for roughly 85% of industrial production). Excluding autos, manufacturing production rose 0.1% in June, putting the annualized gain in the second quarter at only 1.5% compared with a 6.0% increase in the first quarter. This gain is the smallest for the eight quarters of the recovery underway. The operating rate of the nation's industries (74.4%) and factories (76.7%) held steady in June.


