


7/20/2011 9:15:26 AM
Solid earnings beats and the headway in the debt ceiling negotiations drive stocks higher...
Recommendation:
Take no action.
Click here to access our stock market chat rooms today! For a limited time, try our chat room for free. No subscription necessary to give it a try.
Stock Market Trends:

- ETF Positions indicated as Green are Long ETF positions and those indicated as Red are short positions.
- The State of the stock market is used to determine how you should trade. A trending market can ignore support and resistance levels and maintain its direction longer than most traders think it will.
- The BIAS is used to determine how aggressive or defensive you should be with an ETF position. If the BIAS is Bullish but the stock market is in a Trading state, you might enter a short trade to take advantage of a reversal off of resistance. The BIAS tells you to exit that ETF trade on "weaker" signals than you might otherwise trade on as the stock market is predisposed to move in the direction of BIAS.
- At Risk is generally neutral represented by "-". When it is "Bullish" or "Bearish" it warns of a potential change in the BIAS.
- The Moving Averages are noted as they are important signposts used by the Chartists community in determining the relative health of the markets.
Best ETFs to buy now (current positions):
Long DIA at $125.90
Long SPY at $134.43
Long QQQ at $58.20
Click here to learn more about my services and for our ETF Trend Trading.
Value Portfolio:
We are long TBT at $32.50 from June 16th. (TBT closed at $32.00 on July 19th)
We sold short one contract TLT Aug $98 Calls at $1.80 per share on June 16th
We sold short one contract TLT Sep $98 Calls at $2.13 per share on June 16th
(TLT closed at $97.22 on July 18th so the contracts we sold are a dollar out of the money. Time value on all option contracts we sold continues to erode which means we can buy them back for less than we sold them for or, if price stays below $98.00, let them expire worthless and keep all the money).
Daily Trading Action
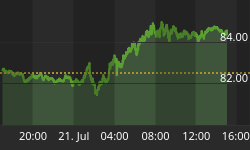
The major index ETFs opened higher and rocketed higher from the open cresting an hour later before settling into a light volume pull back that lasted until the end of the lunch hour. From that point, the bulls ran the major indexes strongly higher for a half hour and then see-sawed them higher into the close with the major indexes closing just off their highs. This allowed the S&P-500 to once again clear the 20- and 50-Day Moving Averages (DMAs). All three have a BULLISH BIAS and are in trading states as we get set for the NASDAQ-100 to confront its highs for the year and for the Dow and S&P-500 to confront recent highs. The Semiconductor Index (SOX 397.41 +12.78) rocketed 3.33% higher! That was clearly some short covering on the oversold index. The Russell-2000 (IWM 83.32 +1.84) roared back 2.25%. The Regional Bank Index (KRE 25.14 +0.47) added most of two percent and the Bank Index (KBE 22.99 +0.29) managed a gain of more than one percent as did the Finance Sector ETF (XLF 14.83 +0.18). Long term bonds (TLT 97.22 +1.98) added two percent in its strongest one day gain in quite awhile. It looks set to retest its high and is currently at downtrend resistance. TLT is above all moving averages we regularly report on but the BIAS of longer term bonds in BEARISH and is in a trading state. NYSE trading volume was light (almost the same as on Monday) with 871M shares traded. NASDAQ share volume was light and just a little heavier than on Monday with 1.690B shares traded.
There were two economic reports of interest released:
- Housing Starts (Jun) came in at 629K versus an expected 570K
- Building Permits (Jun) came in at 624K versus an expected 609K
Both reports were released an hour before the open. The May reports were revised with Housing Starts in May revised down from 560K to 549K and Building Permits revised down from 612K to 609K. Housing is showing much better than expected growth. This follows Monday's NAHB reading of 15 that was higher than the expected 14.
The U.S. dollar fell about two tenths of one percent on the day.
The yield for the 10-year note fell two basis points to close at 2.89. The price of the near term futures contract for a barrel of oil rose +$1.57 to close at $97.50.
Implied volatility for the S&P-500 (VIX 19.21 -1.74) fell more than eight percent and the implied volatility for the NASDAQ-100 (VXN 20.46 -2.02) fell nine percent. We continue to believe that a reduction in implied volatility is likely to occur in the short term and there is a reasonable probability that we just saw the local closing high for implied volatility on Monday.
Tech (+2.7%) led sectors higher as all ten economic sectors in the S&P-500 finished with gains with Utilities (+0.8%) bringing up the rear.
Market internals were positive with advancers leading decliners nearly 4:1 on both the NYSE and the NASDAQ. Up volume led down volume 5:1 on both the NYSE and the NASDAQ. The index put/call ratio fell -0.37 to close at 0.86. The equity put/call ratio fell -0.18 to close at 0.52.
Commentary:
Tuesday was a day when earnings reports took over. The number of companies beating expectations and the significance of those beats was overwhelming. With President Obama stating that he saw progress on negotiations on the debt ceiling, that was enough for more buying in the afternoon session. We will continue to discuss the focus for this week as split three ways:
- U.S. Debt Ceiling negotiations to avoid a reduction to the U.S. AAA credit rating
- European sovereign debt stability and bailouts
- Q2 Earnings season where some 300 companies are set to report in the coming week
There will be a vote taken regarding the European sovereign debt issues on Thursday and we would expected an oversold snap back rally in anticipation of this vote
We continue to be concerned that the top for equities may already be in. With that said, we do expect an oversold bounce that could propel the major indexes up toward recent highs. It appears that the NASDAQ-100 has the potential to overshoot its highs as the Dow and S&P-500 struggle to push up to their respective levels.
We hope you have enjoyed this edition of the McMillan portfolio. You may send comments to mark@stockbarometer.com.


