


7/21/2011 8:52:23 AM
The leap higher on Tuesday was followed by modest losses on Wednesday...
Recommendation:
Take no action.
Click here to access our stock market chat rooms today! For a limited time, try our chat room for free. No subscription necessary to give it a try.
Stock Market Trends:

- ETF Positions indicated as Green are Long ETF positions and those indicated as Red are short positions.
- The State of the stock market is used to determine how you should trade. A trending market can ignore support and resistance levels and maintain its direction longer than most traders think it will.
- The BIAS is used to determine how aggressive or defensive you should be with an ETF position. If the BIAS is Bullish but the stock market is in a Trading state, you might enter a short trade to take advantage of a reversal off of resistance. The BIAS tells you to exit that ETF trade on "weaker" signals than you might otherwise trade on as the stock market is predisposed to move in the direction of BIAS.
- At Risk is generally neutral represented by "-". When it is "Bullish" or "Bearish" it warns of a potential change in the BIAS.
- The Moving Averages are noted as they are important signposts used by the Chartists community in determining the relative health of the markets.
Best ETFs to buy now (current positions):
Long DIA at $125.90
Long SPY at $134.43
Long QQQ at $58.20
Click here to learn more about my services and for our ETF Trend Trading.
Value Portfolio:
We are long TBT at $32.50 from June 16th. (TBT closed at $32.70 on July 20th)
We sold short one contract TLT Aug $98 Calls at $1.80 per share on June 16th
We sold short one contract TLT Sep $98 Calls at $2.13 per share on June 16th
(TLT closed at $96.07 on July 18th so the contracts we sold are about two dollars out of the money. Time value on all option contracts we sold continues to erode which means we can buy them back for less than we sold them for or, if price stays below $98.00, let them expire worthless and keep all the money).
Daily Trading Action
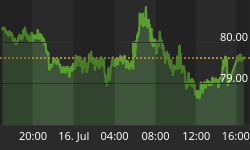
The major index ETFs opened higher but with futures dropping into the open. That momentum continued lower until the Dow and S&P-500 found their lows in negative territory just after 10:15am. The NASDAQ-100 bounced at the same time but when all three rolled over shortly after 11:00am, the NASDAQ-100 found a new low late during the lunch hour. The major indexes then moved higher until peaking just before 2:00pm with the NASDAQ-100 retesting Tuesday's close before succumbing to more selling through the rest of the afternoon. The Dow and S&P-500 also continued to slide lower but both started in positive territory just before 2:00pm. When the market closed, the S&P-500 had lost a fraction of one point to close at 1325.84 and the Dow had lost some fifteen points to close at 12571.91. The NASDAQ-100 lost ten points to close at 2387.80. All three have a BULLISH BIAS and are in trading states. The Semiconductor Index (SOX 395.11 -2.30) posted a fractional loss after gaining 3.33% on Tuesday. The Russell-2000 (IWM 83.18 -0.14) posted a modest fractional loss. The Regional Bank Index (KRE 25.36 +0.22) posted a gain of nearly one percent and the Bank Index (KBE 23.29 +0.30) managed a gain of more than one percent as did the Finance Sector ETF (XLF 15.00 +0.17). Long term bonds (TLT 96.07 -1.15) lost more than one percent after opening even lower. TLT is above all moving averages we regularly report and the BIAS of longer term bonds shifted to NEUTRAL and is in a trading state. NYSE trading volume was light with 796M shares traded. NASDAQ share volume below average with 1.880B shares traded.
In addition to the weekly crude oil inventory report, there were two economic reports of interest released:
- MBA Mortgage Index (Jun) rose +15.5% versus last week's fall of -5.1%
- Existing Home Sales (Jun) came in at 629K versus an expected 570K
The first report was released two and one half hour before the open. The latter report was released a half hour into the session.
The U.S. dollar fell nearly one half of one percent on the day.
The yield for the 10-year note rose four basis points to close at 2.93. The price of the near term futures contract for a barrel of oil rose ninety cents to close at $98.40. The weekly U.S. government report on crude oil inventories showed a draw down of 3.727M barrels.
Implied volatility for the S&P-500 (VIX 19.09 -0.12) fell fractionally while the implied volatility for the NASDAQ-100 (VXN 21.06 +0.60) rose three percent after opening on the support of its 200-DMA. We continue to believe that a reduction in implied volatility is likely to occur in the short term and there is a reasonable probability that we just saw the local closing high for implied volatility on Monday.
Financials (+1.1%), Utilities (+0.6%), and Industrials (+0.2%) were the only economic sectors in the S&P-500 to close with gains. Telecom and Materials were unchanged while the other five sectors recorded losses led by Consumer Discretionary (-0.6%).
Market internals were mixed with advancers leading decliners 4:3 on the NYSE while decliners led advancers 3:2 on the NASDAQ. Up volume led down volume 3:2 on the NYSE while the opposite was the case on the NASDAQ. The index put/call ratio rose +0.13 to close at 0.99. The equity put/call ratio rose +0.10 to close at 0.62.
Commentary:
Wednesday was a day where a lack of news from the Senate's Gang of six was expected but never received. The Gang of six has three Democrat and three Republican senators working on a compromise that would reduce the deficit through a combination of tax hikes and a reduction in government spending. When that effort is completed, it will provide certainty to the market. Until that happens, a deal to at least temporarily hike the debt ceiling is likely to be announced by the deadline of August 2nd. The three things that we remain focused on are:
- U.S. Debt Ceiling negotiations to avoid a reduction to the U.S. AAA credit rating
- European sovereign debt stability and bailouts
- Q2 Earnings season where some 300 companies are set to report in the coming week
Before U.S. markets open on Thursday, Germany's Chancellor Merkel and France's President Nicolas Sarkozy met in Berlin for a seven hour meeting and agreed on the next bailout of Greece which will be 71 billion Euro in new aid and 50 billion in a bank levy. This will get indirect participation of banks (that hold Greek sovereign debt) to allay some of the costs of the bailout. This essentially compels private investors (banks) to share in the pain of writing down some of the Greek debt. This may not trigger a selective default by Greece.
At this point, we believe that the markets will likely continue to move higher to retest the May 2nd highs but it isn't clear how long the process will take. We have already seen an oversold bounce and the market took Wednesday to try to digest the enormity of the bounce. Most telling was that financials led the rally higher. Without financials holding the Dow and S&P-500 back, it is likely that the advance toward those May 2nd highs will begin before the end of this week.
We hope you have enjoyed this edition of the McMillan portfolio. You may send comments to mark@stockbarometer.com.


