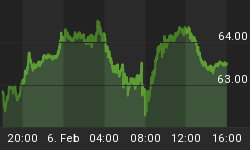
Here is the chart recap from my notes this week.
Sunday
As the market pulled into another week in earning season, all eyes were on the financial sector as the likes of Bank of America, Goldman Sachs, Wells Fargo and Morgan Stanley were reporting.
As you can see in the chart below - the banks (BKX) have already broken through their initial support ~ 47 and pulled up for a third time to the critical level around ~ 46. Since the equity market high in late April, each time the BKX has taken another leg lower - the market has followed suit shortly thereafter. - Mining For Risk
And while the BKX lost critical support at 46 on Monday, it was quickly recaptured in the Tuesday session.


Monday
After a strong bounce in the silver pits - a few long-term charts for perspective.


Tuesday
After utilizing the 2008 analog during silver's initial breakdown in May - a look and comparison of silver's full arc in 2008.
Respecting the 50% fibonacci retracement level and almost identical 2008 RSI pivot, SLV turned sharply lower in the Tuesday session.


Coming into the week, some momentum indicators were on the fulcrum of weekly sell signals. By the close of the week those signals were violated with strength.


Wednesday
After consolidating for over six months - Apple broke out of its range after reporting strong earnings. If recent history is any guide - it appears the market will follow its lead to new highs in the coming weeks.

Friday
A look at the strong correlation in the 10 year yield and the BKX bank index.

While the quarter is still young - it appears the market turned lemons into lemonade by the end of the week.
Disclaimer: Position in UUP & GLL
I just joined Twitter. All my active trades and occasional market musings are disclosed in real-time here.


