


You can make a ton of money trading the Gold and Mining Stocks market. Trading can be very short-term (one or two days), short-term (1 to 4 weeks) or longer. Trading one week or longer involves market timing. The key to making money is knowing when to buy, what instrument to trade in, and when to sell. This article will discuss all three, but focuses primarily on trading Gold and the HUI Mining Stocks Index in a one to four week time frame.
A 5 to 10 percent move in Gold or the HUI can produce returns of 20 to 100 percent or more in the options markets. Trading options is best conducted using no more than a 4 week time frame because the time premium built into the price of options works against the price gain you are realizing from a move in the markets. When trading options, the key is when to get in, making sure that when you get in there is a 5 to 10 percent move coming, and when to get out before the trend (even a corrective counter move) occurs, which can eat up all your profits very fast. The other way to trade Gold and the HUI is to trade ETFs such as GLD for Gold and GDX for the HUI. The returns won't be as dramatic as with options, but conservative traders can still make a nice return if they enter at the right time and exit at the right time.
Don't let anyone kid you. Market Timing can make you a ton of money, even with Gold and Mining Stocks. There are typically up to 10 or more rising and declining meaningful tradable trends every year in Gold or the HUI. Wouldn't it be nice to play the rallies and the declines, to profit no matter what is happening in these markets? You can. Here is how:
First we need to understand that we are not looking to trade small moves. We want high probability multi-week 5 to 10 percent price moves or more. To identify when these trends are coming, we need two types of signals. "Get Ready" signals and "Go, or Trigger" signals.
We find that the best trading occurs off of momentum, not news, not speculation, not earnings per share. Trading options and ETFs requires having access to terrific momentum measure indicators. We like to follow the Daily and Weekly Full Stochastic, RSI and MACD Momentum indicators for our "Get Ready" signals. This does not mean we enter a trade off of these measures; it means we get ready to enter a trade. We get focused, have our money and strategy lined up, spend a little more time on the computer, watching the markets, paying attention to that moment when a Trigger signal arrives. The reason we do not enter a new trade off the Full Stochastic, MACD or RSI momentum indicators is because they can stay overbought or oversold for a long time, and if you rely upon them for entry, you may be getting in far too soon. However, when the Daily or Weekly indicators are overbought or oversold, at extremes, or in the case of the MACD, their histograms are curling over or under, peaking or troughing, that is a great "get ready" signal. They provide a nice early warning for when to enter. However, after they supply a "Get Ready" signal, we still will need a highly reliable trigger indicator that won't get faked out when a new trend that can be traded for profit is starting. We want a signal that, when it says, "Go," we can enter the trade with high confidence of successful profitable results.
We have found that the best indicator as a trigger to enter a trade is the Purchasing Power Indicator. We calculate this and report it each night in our Daily and Weekend Newsletters at www.technicalindicatorindex.com, which also is very effective for trading or market timing Gold and the HUI Mining Stocks index. It has done a remarkable job identifying high probability 1 to 4 week trend turns that result in 5 to 10 percent moves in Gold and the HUI, enough to make a nice profit on options or ETF trades. While it is not perfect, it is very good. The following chart and tables show its performance over the past two years, since July 2009:
Performance of Our HUI Purchasing Power Indicator Buy Signals
On Gold the Metal From July 2009 through July 2011
| HUI PPI Buy Signal Date | GOLD's Closing Price | Date of Furthest Price Move In Direction of Signal | Furthest Extent Of Price Move | Price Gains | Percent Move |
| 7/15/09 | 937.5 | 7/27/09 | 960 | 22.5 | 2.40% |
| 7/31/09 | 955.8 | 8/6/09 | 974.3 | 18.5 | 1.94% |
| 9/2/09 | 978.5 | 9/17/09 | 1025.8 | 47.3 | 4.83% |
| 10/6/09 | 1039.7 | 10/14/09 | 1072 | 32.3 | 3.11% |
| 11/20/09 | 1058.6 | 12/3/09 | 1227.5 | 168.9 | 15.96% |
| 1/4/10 | 1118.3 | 1/11/10 | 1163 | 44.7 | 4.00% |
| 2/5/10 | 1052.8 | 3/3/10 | 1145.8 | 93 | 8.83% |
| 4/1/10 | 1126.1 | 4/12/10 | 1170.7 | 44.6 | 3.96% |
| 4/28/10 | 1171.8 | 5/14/10 | 1249.7 | 77.9 | 6.65% |
| 6/2/10 | 1222.6 | 6/21/10 | 1266.5 | 43.9 | 3.59% |
| 8/6/10 | 1205.3 | 10/14/10 | 1388.1 | 182.8 | 15.17% |
| 11/4/10 | 1383.1 | 11/9/10 | 1424.3 | 41.2 | 2.98% |
| 12/2/10 | 1389.3 | 12/7/10 | 1432.5 | 43.2 | 3.11% |
| 2/1/11 | 1340.3 | 3/7/11 | 1445.7 | 105.4 | 7.86% |
| 3/23/11 | 1438 | 4/11/11 | 1478 | 40 | 2.78% |
| 5/27/11 | 1536.3 | 6/6/11 | 1555 | 18.7 | 1.22% |
| 7/5/11 | 1512.7 | 7/19/11 | 1610.7 | 98 | 6.48% |
| Rally Points From 3/9/09 to 7/15/11 | Total | 1122.9 | |||
| Gold at 7/15/09 | 937.5 | ||||
| Gold at 7/22/11 | 1599.6 | ||||
| Rise in Index | Total | 662.1 | |||
| Conclusion: PPI Signals Identified 170 % of the Up Points as Gold Rose | |||||
Performance of Our HUI Purchasing Power Indicator Sell Signals
On Gold the Metal from July 2009 through July 2011
| HUI PPI Sell Signal Date | GOLD's Closing Price | Date of Furthest Price Move In Direction of Signal | Furthest Extent Of Price Move | Price Gains | Percent Move |
| 7/29/09 | 927.2 | 7/30/09 | 928.4 | -1.2 | -0.13% |
| 8/17/09 | 935.8 | 8/19/09 | 933.3 | 2.5 | 0.27% |
| 9/23/09 | 1014.4 | 9/25/09 | 985.5 | 28.9 | 2.85% |
| 10/26/09 | 1042.8 | 10/30/09 | 1026.9 | 15.9 | 1.52% |
| 12/4/09 | 1169.5 | 12/22/09 | 1075.2 | 94.3 | 8.06% |
| 1/12/10 | 1129.4 | 2/5/10 | 1044.5 | 84.9 | 7.52% |
| 3/24/10 | 1088.8 | 3/25/10 | 1085.5 | 3.3 | 0.30% |
| 4/19/10 | 1135.8 | 4/22/10 | 1132 | 3.8 | 0.33% |
| 5/19/10 | 1193.1 | 5/21/10 | 1166 | 27.1 | 2.27% |
| 7/1/10 | 1206.7 | 7/28/10 | 1155.6 | 51.1 | 4.23% |
| 10/19/10 | 1336 | 10/22/10 | 1315.6 | 20.4 | 1.53% |
| 11/9/10 | 1410.1 | 11/16/10 | 1329 | 81.1 | 5.75% |
| 12/8/10 | 1383.2 | 1/28/11 | 1307.7 | 75.5 | 5.46% |
| 3/10/11 | 1412.5 | 3/15/11 | 1380.7 | 31.8 | 2.25% |
| 4/12/11 | 1453.6 | 4/14/11 | 1453.2 | 0.4 | 0.03% |
| 6/6/11 | 1547.2 | 6/13/11 | 1511.4 | 35.8 | 2.31% |
| Decline Points From 7/29/09 to 7/22/11 | Total | 555.6 | |||
| Conclusion: HUI PPI Signals Caught Significant Price Moves | |||||
Performance of Our HUI Purchasing Power Indicator Buy Signals
from March 2009 through July 2011
| HUI PPI Buy Signal Date | S&P500 Closing Price | Date of Furthest Price Move In Direction of Signal | Furthest Extent Of Price Move | Price Gains | Percent Move |
| 3/18/09 | 304.23 | 4/1/09 | 343.22 | 38.99 | 12.82% |
| 4/24/09 | 310.81 | 6/2/09 | 398.1 | 87.29 | 28.08% |
| 6/25/09 | 359.8 | 7/1/09 | 354.54 | -5.26 | -1.46% |
| 7/15/09 | 343.23 | 7/20/09 | 362.6 | 19.37 | 5.64% |
| 7/31/09 | 360.4 | 8/4/09 | 380.76 | 20.36 | 5.65% |
| 9/2/09 | 383.66 | 9/16/09 | 448.31 | 64.65 | 16.85% |
| 10/6/09 | 439.08 | 10/13/09 | 458.85 | 19.77 | 4.50% |
| 11/20/09 | 426.28 | 12/2/09 | 516.16 | 89.88 | 21.08% |
| 1/4/10 | 444.82 | 1/11/10 | 475.32 | 30.5 | 6.86% |
| 2/5/10 | 259.58 | 3/3/10 | 433.99 | 174.41 | 67.19% |
| 4/1/10 | 428.04 | 4/9/10 | 453.42 | 25.38 | 5.93% |
| 4/28/10 | 456.87 | 5/12/10 | 502.15 | 45.28 | 9.91% |
| 6/2/10 | 462.34 | 6/28/10 | 501.22 | 38.88 | 8.41% |
| 8/6/10 | 459.94 | 10/14/10 | 536.88 | 76.94 | 16.73% |
| 11/4/10 | 548.13 | 11/9/10 | 588.15 | 40.02 | 7.30% |
| 12/2/10 | 564.53 | 12/7/10 | 598.36 | 33.83 | 5.99% |
| 2/1/11 | 520 | 3/7/11 | 581.73 | 61.73 | 11.87% |
| 3/23/11 | 572.48 | 4/8/11 | 609.22 | 36.74 | 6.42% |
| 5/27/11 | 550.4 | 5/31/11 | 556.7 | 6.3 | 1.14% |
| 7/5/11 | 528.42 | 7/22/11 | 580.9 | 52.48 | 9.93% |
| Rally Points From 3/9/09 to 7/15/11 | Total | 957.54 | |||
| HUI at 3/18/09 | 304.23 | ||||
| HUI at 7/22/11 | 578.29 | ||||
| Rise in Index | Total | 274.06 | |||
| Conclusion: PPI Signals Identified 349 % of the Up Points as the HUI Index Rose | |||||
Performance of Our HUI Purchasing Power Indicator Sell Signals
from March 2009 through July 2011
| HUI PPI Sell Signal Date | S&P500 Closing Price | Date of Furthest Price Move In Direction of Signal | Furthest Extent Of Price Move | Price Gains | Percent Move |
| 4/3/09 | 307.44 | 4/22/09 | 279.95 | 27.49 | 8.94% |
| 6/3/09 | 374.71 | 6/22/09 | 318.27 | 56.44 | 15.06% |
| 7/6/09 | 329.07 | 7/8/09 | 312.98 | 16.09 | 4.89% |
| 7/29/09 | 335.34 | 7/30/09 | 335.34 | 0 | 0.00% |
| 8/17/09 | 338.7 | 8/19/09 | 337.36 | 1.34 | 0.40% |
| 9/23/09 | 413.24 | 10/2/09 | 391.47 | 21.77 | 5.27% |
| 10/26/09 | 411.38 | 10/30/09 | 377.2 | 34.18 | 8.31% |
| 12/4/09 | 470.9 | 12/22/09 | 416.02 | 54.88 | 11.65% |
| 1/12/10 | 447.14 | 2/5/10 | 363.25 | 83.89 | 18.76% |
| 3/24/10 | 399.61 | 3/25/10 | 392.56 | 7.05 | 1.76% |
| 4/19/10 | 427.74 | 4/22/10 | 422.88 | 4.86 | 1.14% |
| 5/19/10 | 452.34 | 5/21/10 | 419.65 | 32.69 | 7.23% |
| 7/1/10 | 453.52 | 7/27/10 | 429.33 | 24.19 | 5.33% |
| 10/19/10 | 495.16 | 10/27/10 | 490.37 | 4.79 | 0.97% |
| 11/9/10 | 550.34 | 11/16/10 | 525 | 25.34 | 4.60% |
| 12/8/10 | 563.51 | 1/25/11 | 492.04 | 71.47 | 12.68% |
| 3/10/11 | 539.36 | 3/16/11 | 517.89 | 21.47 | 3.98% |
| 4/12/11 | 580.87 | 5/13/11 | 507.98 | 72.89 | 12.55% |
| 6/6/11 | 521.77 | 6/16/11 | 487.96 | 33.81 | 6.48% |
| Decline Points From 2/10/09 to 7/15/11 | Total | 594.64 | |||
| Conclusion: HUI PPI Signals Caught Significant Price Moves | |||||
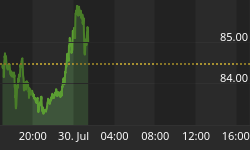
Since it triggered a new buy signal on July 5th, 2011, which appeared to many to come out of the blue, but this indicator is smart, a cold calculation of market internal data and momentum, since this buy signal on June 21st, the HUI Amex Gold Bugs Index has risen 52 points, or 9.9 percent, and Gold has risen 98 points, or 6.5 percent to a new all-time high. And the signal remains on a buy so more upside could be coming for this trade. It saw this past three week's mega rally coming before pretty much everyone. All was doom and gloom when our HUI PPI generated a new buy signal that proved prescient once again.

The beauty of short-term market timing trading is you get opportunities to make money during the impulsive Gold and Mining Stock Index moves in the direction of the primary long-term trend, but also you get to play the deeper corrective counter-trend moves as well. You can make money whether Gold and Mining Stocks go up or down. Given the normal cycle of market moves, there could be as many as 10 or 20 moves of 5 to 10 percent per year! That is a lot of trading opportunity that buy and hold completely misses.
Times are tough right now. Making money is important. Protecting money is important. Being aggressive with a small budget of funds you are willing to take a chance with, and trade, requires discipline and a willingness to lose money from time to time, but can be very beneficial. We like limiting risk to no more than 2 percent of capital when doing market timing trading with options, and no more than 10 percent with cash market ETFs.
We have a Platinum Trading Service at www.technicalindicatorindex.com where we do the trading with our own money, in real time, that subscribers can follow along with, for either educational purposes, or for ideas to do their own market timing trading within 15 minutes of when we trade.
A trader can make a lot of money without risking a lot of money. By buying Call or Put options long, our loss risk is limited to the amount of money we invest in the options. In our Platinum Trading Service, for the first 6 months of 2011 we limited risk to an average trade of ½ percent of our total portfolio capital, and were able to gain a return on that investment of 282 percent - in just the first six months of 2011. If you had $25,000 of risk capital, that could have been turned into $70,000 in six months using our Platinum Trading Service. That is a nice return with the only downside risk being ½ or one percent of one's portfolio. Past performance is no guarantee of future performance, but the point is, the Purchasing Power Indicator, used in connection with other momentum indicators we follow, resulted in terrific results with minimum risk.
If someone did not want to join our Platinum Trading Service, did not need the hand holding, they could simply use our Purchasing Power Indicator and other indicators of their own choosing to conduct trades themselves in either the options market, or another market which also presents terrific opportunities for market timing traders such as ETFs.
Successful trading not only takes discipline to wait for trigger signal changes to enter, and discipline to limit the amount invested to an amount we can afford to lose, but it also requires knowing when to sell, to either take losses on a losing trade and get out, or when to take a profit on a winning trade. Exiting is in the eye of the beholder, depending upon the trader's risk appetite, experience, and financial position. We like to set a goal, and once that profit goal is achieved, to grab the money and run. You will never lose money taking profits. The temptation is always to get greedy, and stay in too long. This is where judgment, experience, and discipline help a lot. Are you happy with a 20 percent profit in an options trade? A 50 percent profit? Not may trades go to 100 percent, but some do. That decision requires a gut check. We like to sell at the sleep-at-night level. Certainly market conditions play a part, but the best read on a market can go sour fast with news events or a fast turn in market psychology. Some people like to enter when we get a new buy or sell signal in our Purchasing Power Indicator and then sell when certain reliable momentum indicators approach overbought or oversold in the direction of the trade.
We offer you the option of calling your own shots at www.technicalindicatorindex.com or plugging into our thoughts and following along with our Platinum Trading Service. The decision is up to you.
We cover a host of indicators and patterns, and present charts for most major markets in our International and U.S. Market reports, available to subscribers at www.technicalindicatorindex.com
If you would like to follow us as we analyze precious metals, mining stocks, and major stock market indices around the globe, you can get a Free 30 day trial subscription by going to www.technicalindicatorindex.com and clicking on the Free Trial button at the upper right of the home page. We prepare daily and expanded weekend reports, and also offer mid-day market updates 3 to 4 times a week for our subscribers.
"Jesus said to them, "I am the bread of life; he who comes to Me
shall not hunger, and he who believes in Me shall never thirst.
For I have come down from heaven,
For this is the will of My Father, that everyone who beholds
the Son and believes in Him, may have eternal life;
and I Myself will raise him up on the last day."
John 6: 35, 38, 40


