


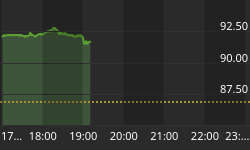


As the days and hours tick by, many Americans, and most investors I would think, are likely getting a deeper and deeper sinking feeling about the thus far unresolved situation in Washington.
As I will argue below, even with just days before the Aug. 2 deadline, no one, from politicians on down, can say what the end result will be, neither regarding the government itself, nor for financial markets. While raising the debt ceiling will lift some of the fears, obviously many in Washington seem to think that will not be enough, as almost all the wrangling has little to do with the ceiling itself and everything to do with how much to cut the budget deficit and when.
While no one can predict how all of this will play out, I advise investors to try to take a long-term perspective on the issue. The bulging budget was not created overnight, but rather over at least a decade, and it is not likely to be resolved in a single weekend. Rather, it is more likely to take years to see if we are really going to be able to get a satisfactory fix on the situation.
If my premise turns out to be true, it might suggest that investors continue to go about their business in a relatively normal fashion, mindful of the situation but not paralyzed by it. Perhaps far more worrisome to everyday decision making in managing your investments should be the implications for investors of high unemployment, low consumer spending, and the current path of growth which, according to newly released figures, show that the economy is weak enough to be flirting with a new stall out. Given such weakness, we believe investors should continue to hold on to their bonds in spite of the uncertain prospects for a cut in the US's credit rating. If such a cut does happen, it would most likely affect mainly government bonds, and long-term ones at that. But since the stock market would not like a credit-rating downgrade either, investors would still need a place to go, and that well could be the whole range of non-government bonds available, as presented in my July Newsletter.
You might be scratching your head right now regarding this article's title saying something like: Buy signals? Why would anyone want to be adding to their stock positions in the current climate?
In order to explain, it is necessary for readers to understand how our BUY signals are generated. First of all, a BUY signal is not based on some expert sitting down and weighing the pros vs. the cons of many of the variables out there and deciding that, in balance, these factors suggest favorable prospects. In fact, if we were to weigh such variables, it would be far more likely that we might come up with a either a negative view of most stock prospects, or perhaps at best, a neutral one, at least on a short-term basis.
As this is being written, a huge cloud continues to hover over the entire stock market, that is, the apparent paralysis in Washington as to how to resolve the budget deficit as well as the debt ceiling. Dire warnings, most of which we agree with, have been issued by most experts as to what will happen if these issues cannot not be come to grips with in an adequate and timely manner. Pessimism seems to be mounting by the day. Add to this such apparently highly negative economic data as a far too high unemployment rate, a "soft patch" (or even worse) in the economy, and more than the usual number of economic frailties around the globe and one is presented with a picture that might hardly suggest across the board Buy signals for stocks. (See the separate section about our most recent BUY signals below.)
But, as alluded to above, our BUY signals have absolutely nothing to do with attempting to make an appraisal of either these possibly market depressing factors, nor counterbalancing positive indicators. Rather, the recommendations which we make as to BUY (also SELL, or HOLD) are issued essentially in an automatic fashion based on a formula which weighs both the relative degree of long-term undervaluation of an investment category along with the degree of positive strength the investment has been showing (what we call momentum) also over a significant period of time.
Why do we weigh these two factors to the exclusion of all others, and isn't this a serious flaw since any trained economist knows that a whole variety of factors influence stock prices? These are good points but it turns out there are equally good, if not better, reasons for taking the approach we do as opposed to choosing to apply a more comprehensive analysis.
Yes, we still believe that a variety of additional factors may, at any time, prove to far outweigh our undervaluation and momentum ratings in pulling or pushing stocks either up or down, or keeping them close to their current level. But the question that must be considered is this: Can anyone reliably predict in advance how these variables will play themselves out? For example, given the current paralysis in Washington, who among us should be regarded as having a clear enough crystal ball to say whether any possible action by Congress (and/or the President) either will or will not satisfy the majority of investors around the world (as well as the credit rating entities) who ultimately will determine the likely future direction of interest rates, the US dollar, and most likely, U.S. stock prices? And, will US unemployment improve enough (and how much is "enough") in the future to reassure investors, or not. If the former, perhaps stock prices can be expected to rise; if not, perhaps they will sink (but, of course, then the Fed may elect to do more to stimulate the economy, perhaps making stock prices rise again).
By the time some readers read this article, we expect that there likely will have been some degree of resolution to the debt crisis given the Aug. 2 deadline. However, in our view, it remains unlikely that the compromise arrived at will provide enough clarity to suggest a straightforward answer to the above questions.
So the problem is not that we have no idea of what many of the significant variables that influence stock prices are and in what direction (either up or down), but rather, how can any single expert repeatedly be counted on to know what the future will hold? Unfortunately, in our view, almost all of the expert analysis which purports to suggest where the stock market might be headed, is based on the notion that at any given moment, a reasonably accurate reading of what will happen in the future is possible, and that this reading should be the basis for making important investment decisions. If such expert prediction were indeed possible, it would seem that data would be available to show such accurate forecasting acumen. While we acknowledge that a few experts may have published track records that suggest they are somewhat better than most in making such predictions, the lack of availability of such a significant value-added level of forecasting should be obvious to most who have seriously studied the stock market.
Our BUY, SELL, or HOLD recommendations use the above two built-in, relatively constant assumptions about the future. Our research has found reliable evidence that essentially confirms that these assumptions do seem to characterize the performance of stock fund categories regardless of such factors as interest rates, unemployment, or whether or not there is gridlock in Washington.
Average stock fund category performance does tend to go in and out of favor over periods often lasting up to five years, but at times lasting even longer. Therefore, the best performing categories of the last five years have a good chance of trailing off much beyond that, and vice versa. We consider this firmly enough established that it affords a high weighting in our BUY, SELL, or HOLD calls. On a more theoretical level, we regard these movements as closely tied to up and down cycles in the economy as well as sectors within the economy and highly related to the notions of under- vs. over-valuation for a set of stocks.
Our research also has reaffirmed that positive momentum, that is, strong stock category performance over significant but less long-lasting periods, is associated with continued positive performance, while the opposite is true for negative momentum. Making use of momentum has been successfully employed by many stock strategists. However, we do not weight it as nearly important as longer-term under- or over-valuation.
Obviously, one might argue, measures of both valuation and momentum for a stock fund category might not always conform to past norms. For example, just because the category of Large Growth stock funds may have shown momentum over the past 6 months, does not ensure that such momentum couldn't reverse at any time. Or as stated above, under- or over-valuation can at times last beyond five years. But our research shows that momentum, as well as valuations, are strong forces that reliably do act as we have suggested above down through the years regardless of what else might be going on in the world or the investment environment.
In summary then, we feel that rather than attempting to predict an essentially unknowable future through a process that is highly dependent on any one person's use of rational forecasts (but still only guesses), it may prove to be more fruitful to stick with the bare minimum of consistently reliable information that we do have. Reliable data tends to remain true regardless of a myriad of unforeseeable factors. We primarily use our signals to identify which categories of stock funds are worthy of currently buying, selling, or holding. However, we continue to make use of a wide variety of forecasting factors, in addition to our above-derived baseline projection for the S&P 500 Index, in setting our overall portfolio allocations to stocks, bonds, and cash. Such overall allocations are likely to be the most important determinant of your investment returns, even more important than your specific choices of which categories of funds within the stock fund universe to invest in.
Evidence Continues to Mount Supporting Using Our BUY, HOLD, and SELL Signals
Three years ago, as described in our Aug. '08 Newsletter, I put together a research-based method for helping readers make BUY, HOLD, and SELL regarding stock mutual fund categories which attempted to find an optimal method for tying together the above two variables, that is, degree of over-/under-valuation and momentum. Prior to that time, from 2000 through mid-2008, we made our recommendations generally using similar criteria, but we applied a less rigorous and somewhat more broad-based set of guidelines. In July 2008, however, we developed a decision- making tool through what is called an empirical research approach. Such an approach begins by ascertaining what appear to be consistent findings based on actual observation and then testing to see if the findings are useful in predicting future results.
We believe that the last three years, while not an extremely long period in judging investment returns, do offer enough time to get a strong sense that our approach has been succeeding. This is especially true since the period includes both a severe down as well as up market which our method has successfully navigated. It should also be pointed out that our methodology was designed to fully reflect the sometimes extreme manner in which stock funds have performed going back to early 1990 to arrive at those critical junctures which have shown to lead to sound forward-looking BUY, HOLD, and SELL signals.
Table 1 shows the action our tool would have recommended regarding the S&P 500 Index at the start of each quarter using the method as well as the actual subsequent performance of the Index one year after the projected course of action, as well as through July 29, 2011.
| Table 1: 1 Yr. Returns & Cumulative Returns Thru 7/29/11 Following SELL, HOLD, and BUY Signals | |||
| Yr, Quarter | Action | Tot. Ret. 1 Yr Later | Cumulative Ret. |
| 2008 3 | Sell | -26.2% | 0.9% |
| 2008 4 | Hold | -6.9 | 10.9 |
| 2009 1 | Hold | 26.5 | 43.1 |
| 2009 2 | Hold | 49.8 | 61.9 |
| 2009 3 | Hold | 14.4 | 40.6 |
| 2009 4 | Hold | 10.2 | 22.2 |
| 2010 1 | Buy | 15.1 | 15.9 |
| 2010 2 | Buy | 15.6 | 10.5 |
| 2010 3 | Hold | 30.7 | 25.3 |
These results show that
- Our single SELL signal has, thus far, proven highly accurate. Even more than 3 years later, that is beginning July 1, 2008 up to the present, returns have been subpar as the signal warned. Our Aug '08 research suggests that even when looking ahead nearly an additional two more years from now (that is, thru June 2013), the S&P's performance from its July 1, 2008 starting level of 1280 might not return to a particularly rewarding level for total returns over the entire 5 year period.
- Our 6 HOLD signals were followed by returns averaging 20.8% one year later; and through July 29, 2011, the average return has been 34.0% (not ann.)
- Our 2 BUY signals were followed by returns averaging 15.4% one year later; and through July 29, 2011, the average return has been 13.2% (not ann.)
You might wonder why our HOLD signals were followed by better performance than our BUY signals. The first 3 HOLD signals issued in 2009 were near what proved to be the bottom of the 2007-2009 bear market. Our system requires stringent criteria to be a BUY so, while in hindsight, these 3 starting dates would have proven to be a great time to buy, these periods were still too risky to meet our Buy criteria - likewise for the HOLD at the beginning of the 3rd qtr. of 2010. (It should be noted that we regard HOLD signals much more positively than just a rather neutral endorsement as might be the case with other ratings that might be labeled "hold." To the contrary, as explained in the Aug '08 Newsletter, we define HOLD signals as still very constructive, although not quite as outstanding as BUY signals; the latter occur much less frequently and can strongly suggest action by value conscious investors.)
Having created our tool for making stock SELL, BUY, and HOLD decisions in Aug. '08, we first began to apply its projections to help construct our Stock Model Portfolios and base our "Alerts" on beginning the 4th Qtr. (Oct.) of '08.
As seen above, the tool projected that by that Oct., in spite of being dead in the midst of a bear market that had driven the Index down -22.0% over the prior year, stocks as represented by the S&P 500 Index, were deemed to be HOLD, but only barely. (That is, they had just slipped slightly below the critical juncture separating a SELL designation into the HOLD category.) Over the following year, the Index wound up losing -6.9% which might be bad news for people other than long-term investors. But going forward, this Oct '08 signal has shown it appears to have been on target. Since bottoming in early March '09 at 667, the Index has climbed to 1292 as of 07/29, or just a little shy of a doubling in price. So while the signal was approximately 5 months early, people who held the Index have earned what we estimate to be 5.7% ann. over the entire period, a modest but respectable total return.
Ever since Oct '08, our HOLD signals for the Index, as well as for all other major stock categories and all of the many BUY signals reported in our monthly Newsletters have proven to be extremely successful, as we have already commented on at various times on our site. (You may want to see the following archived articles: Dec '09, May '10, and Aug '10 where these other findings were reported.)
New BUY Signals for Long-Term Investors Recorded on July 18, 2011
You might think that after all the gains since March '09, this would appear to be perhaps a very dangerous time to add to (or enter) the stock market. Yet, amazingly perhaps, the signals are now showing nearly all Buys as of 7/29/2011. The exceptions, which should still be regarded as Holds, are Technology funds, Emerging and Pacific (ex-Japan funds), and Precious Metals funds.
Note 1: Subscribers to our site were e-mailed notification of these BUY signals on July 20.
Note 2: The exceptions, which should still be regarded as HOLDs, are Technology funds, Emerging and Pacific (ex-Japan funds), and Precious Metals funds.
Of course, one needs to remember that even our research-based recommendations should be used in conjunction with one's own judgment and research on suitable actions based on one's own tolerance for risk and personal financial circumstances.
High Allocations to Stocks Have Been a Highly Successful Year Over Year Strategy Since Oct. 2008
Our Stock Model Portfolios, which emphasize which stock fund categories to invest your stock funds in, have thus far had a mixed record in attempting to best the Index over the following year since we began using our tool. However, in terms of helping investors to decide how much to invest in the market, that is one's overall allocation to stocks, each and every Stock Model Portfolio subsequent to the 5 month "too early call" referred to above, has excelled over the following year, a fact which can be clearly seen in Table 2.
| Table 2: 1 Yr. Buy and Hold Total Return for Our Recent Model Stock Portfolios | ||
| Yr, Quarter | Our Recommended Allocation to Stocks for Moderate Risk/ Aggressive Risk Investors | Tot. Ret. 1 Yr Later |
| 2008 4 | 42.5% / 60% | -2.9% |
| 2009 1 | 37.5 / 50 | 30.3 |
| 2009 2 | 45 / 65 | 49.1 |
| 2009 3 | 50 / 65 | 12.0 |
| 2009 4 | 50 / 65 | 9.0 |
| 2010 1 | 57.5 / 75 | 15.3 |
| 2010 2 | 60 / 80 | 16.3 |
| 2010 3 | 60 / 80 | 32.0 |
As reflected in the table, the average 1 year return for the stock portion of each of the 8 Model Portfolios was 20.1%. Thus, the higher one's overall allocation to stocks, the better one's overall returns would have been over the following year as compared to what was available in either bonds or cash.


