


Investors know that markets can stubbornly stay in an oversold or overbought condition for a long time.
So, how can you analyze the the degree to which something is oversold or overbought?
One way investors do this, is through the use of Standard Deviation measurements. Normally, investors use a Bollinger Band Indicator to measure deviations and use a 20-2-2 setting (a 20 day simple moving average with 2 standard deviations on the upper and lower bands).
The further out you go in standard deviations, the rarer the event being measured. For example:
- 68% of a distribution lies within one standard deviation of the mean.
- 95% of a distribution lies within two standard deviations of the mean.
- 99.7% of a distribution lies within three standard deviations of the mean.
If you go back to the bad days of October of 2008, the market had a nasty five day drop where the NYA Index was outside a 5 sigma band for five days in a row. That was a pretty rare occurrence, and one that was filled with fear and panic. During those 5 days, the NYA Index fell a total of 19.5%.
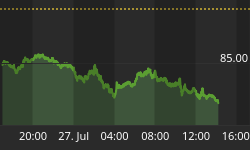
Let's move to yesterday at the close. The NYA Index was at 8040.93 at the close on August 1st. The next day, it closed below a 5 sigma level and did the same for the next two days which took us to yesterday. At that time, it closed at 7428.40 and it was still below the 5 sigma level for the third day. That drop was 7.6176% as of yesterday.
So, how do the two time periods compare?
In October of 2008, the average daily drop was 3.9% per day for the five day period.
For this week, the average daily drop has been 2.539% per day for the three day period.
This is day four, and for the 2.539% drop to be maintained today, the NYA Index would need to drop 188.607 points down to 7239.793. At 11:45 AM today, the NYA Index was at 7323.03 points, down only 105.37 points. So unless the downside accelerates the rest of the day, the speed of the drop will have decreased.
So, while the current drop might seem bad, it is not nearly as bad as the October 2008 drop. The average size of the daily drops have been 35% less than the average daily drops of 2008.
For August 5th: 7239.793 on the NYA Index is the benchmark for today to see if the drop is getting better or worse. Check it before the close at 4 PM ... the symbol is $NYA.
FYI ... While a 5 sigma range drop may seem common from this discussion, 5 sigma days prior to 2007 only occurred an average of 1 day per year for the previous 50 years.


