


The purpose of this article is to address the issue of whether we have just witnessed a genuine and conclusive breakout by gold above the key $430 resistance level, and if not, what is required to complete the job.
It is my view that it is now looking much more certain that we have witnessed a genuine breakout by gold - but the final confirmation will come when it clears $440, at which point buy stops are expected to kick-in and drive it quickly higher. Some readers were confused and thought I was "moving the goal posts" by talking about the importance of gold moving above $440, after having spent weeks, or rather months, talking about the importance of the $430 level. Perhaps some clarification is in order. While it is true that $430 was the key breakout point, a breakout above a resistance level has to be by a margin sufficient to bring about a change in market psychology, in other words it has to go far enough to make the bears at that point realize that they were wrong - when the penny drops they then rush to protect their positions - they cease taking new short positions and cover their existing shorts, at the same time emboldened bulls cease precautionary selling and perhaps increase their long positions. The combination of these factors often results in a rapid increase in prices, and, as we can see looking at recent price behaviour on the accompanying charts, we're not quite there yet. It is my estimation that once gold succeeds in closing above $440 for several sessions, the change in psychology will occur, and this should lead to a more rapid advance away from the $430 area, which will then become a support level.

The 1-year gold chart shows the progress of the past week, with the price having pushed up through the heavy resistance in the $430 area and, having broken above the highs of last winter and spring, is clearly in position to accelerate. It is short-term overbought, however, and it would not damage the bullish picture at all were it to react back to $430, or even to the mid-high $420's. Such a minor reaction would not, in itself, erase the bullish implications of last weeks' advance to a new high towards $439. However, it is considered to be much more likely that it will accelerate upwards from here, perhaps after a brief dip, particularly given the decidedly bearish appearance of the dollar chart.
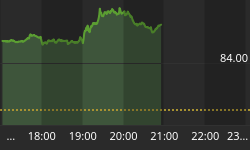
The dollar chart from the start of 2001 shows that the support at 84.60 - 85 has been decisively broken and the outlook now is for a plunge towards the lower trendline which is, as can be seen, quite a long way below the current level.

The 3-year gold chart with its clear uptrend channel gives an idea where gold will go in the event of the dollar dropping to the bottom of its channel. It should go to the top of its channel at about $480 - $500.

A "wild card" for the US economy and especially for the US dollar is that, as the US currently has colossal debts and deficits, vast quantities of dollar assets are held overseas, notably by China and Japan. This means that the economic fate of the US is, to a considerable degree, in the hands of its creditors. China alone holds such an enormous quantity of dollar assets that, just by itself, it could send the dollar straight into the abyss if, for whatever reason or reasons, it decided to have a clearout, although conventional wisdom has it that if it did this it would be shooting itself in the foot.
A newly prepared "Overview of 30 Gold Stocks", containing a brief technical assessment of each stock, including many of the mid and large caps, is available to subscribers on my website www.clivemaund.com and a similar overview for silver stocks is in the pipeline.


