


Don't hold your breath. As Chart 1 shows, moving from a positive spread between the yield on the Treasury 10-year security and the fed funds rate has more often than not in the past 55 years signaled the commencement of a recession on the near-term horizon. There have been a few miscues - instances when a recession occurred without the spread turning negative prior to the onset of the recession and some instances when the spread turned negative but a recession did not ensue. So, like so many other leading indicators, the negative-spread recession indicator is not foolproof.

If a recession were to commence in the next six months or so, is it probable that the "spread" would alert us to this outcome by moving into negative territory? Not bloody likely! Why not? Because the fed funds rate is hovering just above the zero level and is expected to hover there in the foreseeable future. In order for the spread to become negative, the yield on the 10-year Treasury security would have to approach zero. Although there always is a first time, not even during the early 1930s did Treasury bond yields move to zero or below, as shown in Chart 2. For the sake of argument, let's assume that a recession does begin in the next six months. If you were to wait for the spread to move negative as a signal of an imminent recession, you will be like a batter watching a called "strike three."

This is not to say that the spread is devoid of use with regard to making some educated guesses about the course of economic activity in the next six months. When the spread has been "operative" as a recession signal, before going negative, of course, the spread had to narrow. So, the "trend might be your friend" with regard to the behavior of the spread. A narrowing trend in the spread generally indicates weaker economic growth ahead. And that has just how the spread has been behaving in recent months (see Chart 3). Since April 11, the trend in the spread has been one of narrowing - narrowing by 121 basis points by August 8. Bear in mind, this narrowing in the spread has occurred at a time when we might have expected the spread to widen inasmuch as S&P issued its negative ratings watch on U.S. sovereign debt on April 18 and Fed officials had been signaling their intent to cease purchasing Treasury coupon securities by June 30. The fact that the spread narrowed this much in such short time under these conditions is a necessary ingredient for the formation of a recession.

Keep a "weather eye" on the behavior of the sum of Federal Reserve and commercial bank credit (see Chart 4). If this sum heads south, then, along with the narrowing spread, conditions would be conducive for the formation of a recession.

With All Due Respect, Congressman Paul ...
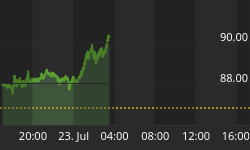
Whenever a statement is prefaced by "with all due respect," you know some disrespectful comment is on the way. So, here goes. On Monday, as stock markets around the world swooned after, but not because of, Friday's downgrade of U.S. sovereign debt by S&P, Congressman Paul said something along the lines of the markets were sending a signal that the U.S. Treasury would not explicitly default on its debt, but rather would implicitly default on its debt via inflation. Presumably, Congressman Paul arrived at this conclusion by observing that the U.S. gold futures nearby contract hit a record high on Monday (see Chart 5). But also on Monday, participants in the Treasury bond market lowered their expectations of the average annual percent change in the CPI, the CPI including food and energy, by 6 basis points to 2.20%. As can be seen in Chart 5, Treasury bond participants have been lowering their 10-year expectations of the rate of CPI increases from mid April, which, coincidentally, is when S&P put U.S. sovereign debt on a negative watch for a downgrade. So there you have it. One direct measure of investors' inflation expectations is signaling an expected lower rate of price increases for goods and services - the breakeven rate of increase in the CPI between the yield on the nominal Treasury 10-year security and the yield on the inflation-protected Treasury 10-year security. Interpreting the behavior of the price of gold is akin to a Rorschach test. Different people can have different interpretations of the same behavior.

A Silver-Lining Evergreen - The Decline in Oil Prices Will Stimulate Consumer Spending
As shown in Chart 6, the price of a barrel of West Texas Intermediate crude oil fell to $81.31 on August 8, the lowest price since November 23, 2010. Some talking heads on the cable financial news channels will tell you that this decline in oil prices could be the catalyst for stronger growth in consumer spending in the coming months. Could be, but might not be. You see, it all depends on why the price of crude oil has been falling since late April. If the price of crude is falling because there has been an increase in the supply of crude oil, then yes, this decline in the price of crude is positive for consumer spending and economic growth in general. But, if the decline in the price of crude is due to a decrease in the demand for crude oil, then the decline in the price of crude oil is symptomatic of weakening global economic growth. Is that bullish for U.S. consumer spending? Now, it has been reported in recent months that the Saudis have stepped up their production of crude and the U.S. and other governments have released crude oil to the market from their strategic reserves - good news for global growth and U.S. consumer spending. However, in recent months, global Purchasing Managers reports have been signaling weaker global economic growth - bad news for global growth and U.S. consumer spending. Putting together the drop in the price of crude oil, the drop in the price of copper and the sharp narrowing in the interest rate spread between the Treasury 10-year yield and the federal funds rate, the preponderance of evidence is that the cause of the drop in the price of crude oil is due to weaker global demand than an increase in supply. In turn, this means that the drop in the price of crude oil is not the silver lining for U.S. consumer spending that the eternal optimists on the cable financial news channels are squawking about.


