


The good news is:
• A bottom appears to be in place.
The negatives
Over the past week we saw some of the most extreme readings in the ratio of upside to downside volume in both directions, ever recorded. This excursion into uncharted territory makes everything suspect and we have not yet seen the rapid deterioration of downside volume that marks a bottom.
The chart below covers the past 6 months showing the NASDAQ composite (OTC) in blue and a 5% trend of NASDAQ downside volume (OTC DV) in brown. OTC DV has been plotted on an inverted Y axis so decreasing downside volume moves the indicator upward (up is good). Dashed vertical lines have been drawn on the 1st trading day of each month.
It would be comforting to see OTC DV leading the way upward. It is not doing that.

The positives
New lows peaked last Monday at 725 on the NASDAQ and 1292 on the NYSE (the most since November 21, 2008 when there were 1109 on the NASDAQ and 1527 on the NYSE), then declined sharply to 62 on the NASDAQ and 24 on the NYSE. Those numbers alone suggest there is very little downside risk.
The chart below covers the past 6 months showing the OTC in blue and a 10% trend (19 day EMA) of NASDAQ new lows (OTC NL) in black. OTC NL has been plotted on an inverted Y axis so decreasing new lows move the indicator upward (up is good).
OTC NL turned upward last week. The value of the indicator is 194 so it will require more than 194 new lows to turn the indicator downward.

The chart below is similar to the one above except it shows the S&P 500 (SPX) in red and NY NL in blue has been calculated from NYSE data.
The value of NY NL is 288 so it would require more than 288 new lows to turn NY NL downward.

Last week, between Monday and Friday, new lows declined by over 90%. It is unlikely the recent lows will be violated.
Seasonality
Next week includes the 5 trading days prior to the 3rd Friday of August during the 3rd year of the Presidential Cycle.
The tables below show the return on a percentage basis for the 5 trading days prior to the 3rd Friday of August during the 3rd year of the Presidential Cycle. OTC data covers the period from 1963 - 2010 and SPX data covers the period from 1953 - 2010. There are summaries for both the 3rd year of the Presidential Cycle and all years combined. Prior to 1953 the market traded 6 days a week so that data has been ignored.
Average returns have been modestly positive over all periods and a little stronger during the 3rd year of the Presidential Cycle.
Report for the week before the 3rd Friday of August.
The number following the year is the position in the presidential cycle.
Daily returns from Monday through 3rd Friday.
| OTC Presidential Year 3 | ||||||
| Year | Mon | Tue | Wed | Thur | Fri | Totals |
| 1963-3 | 0.47% | 0.06% | 0.35% | 0.61% | 0.17% | 1.66% |
| 1967-3 | -0.29% | -0.63% | 0.00% | -0.24% | -0.20% | -1.36% |
| 1971-3 | 2.00% | 0.99% | -0.50% | -0.35% | -0.11% | 2.03% |
| 1975-3 | -0.13% | 0.19% | -0.64% | -0.81% | 0.17% | -1.22% |
| 1979-3 | 0.69% | 0.16% | 0.57% | 0.20% | 0.27% | 1.90% |
| 1983-3 | 0.73% | -0.64% | 0.33% | -0.35% | -0.23% | -0.15% |
| 1987-3 | 0.01% | -1.08% | 0.27% | 1.07% | 0.54% | 0.81% |
| Avg | 0.66% | -0.08% | 0.01% | -0.05% | 0.13% | 0.67% |
| 1991-3 | 0.33% | 0.86% | 0.64% | -0.39% | -0.62% | 0.82% |
| 1995-3 | 0.83% | 0.00% | 1.32% | 0.33% | 0.20% | 2.69% |
| 1999-3 | 0.28% | 0.98% | -0.51% | -1.37% | 1.03% | 0.42% |
| 2003-3 | 1.06% | 1.53% | -0.02% | 0.81% | 0.10% | 3.49% |
| 2007-3 | -0.10% | -1.70% | -1.61% | -0.32% | 2.00% | -1.73% |
| Avg | 0.48% | 0.42% | -0.04% | -0.18% | 0.54% | 1.14% |
| OTC summary for Presidential Year 3 1963 - 2007 | ||||||
| Avg | 0.49% | 0.07% | 0.02% | -0.07% | 0.28% | 0.78% |
| Win% | 75% | 64% | 55% | 42% | 67% | 67% |
| OTC summary for all years 1963 - 2010 | ||||||
| Avg | 0.19% | 0.03% | 0.16% | 0.01% | -0.02% | 0.37% |
| Win% | 65% | 51% | 63% | 53% | 56% | 56% |
| SPX Presidential Year 3 | ||||||
| Year | Mon | Tue | Wed | Thur | Fri | Totals |
| 1955-3 | -0.09% | -0.74% | 0.10% | -0.14% | 0.43% | -0.45% |
| 1959-3 | -0.20% | -0.93% | -0.60% | 1.49% | -0.10% | -0.34% |
| 1963-3 | 0.16% | 0.28% | 0.40% | 0.44% | 0.15% | 1.43% |
| 1967-3 | -0.54% | 0.14% | -0.23% | 0.08% | 0.16% | -0.39% |
| 1971-3 | 2.00% | 1.25% | -1.39% | -0.45% | 0.17% | 1.58% |
| 1975-3 | 0.62% | 0.66% | -1.32% | -0.43% | 0.89% | 0.41% |
| 1979-3 | 0.96% | 0.09% | 0.68% | -0.15% | 0.19% | 1.78% |
| 1983-3 | 0.96% | -0.18% | 1.15% | -1.05% | 0.26% | 1.13% |
| 1987-3 | 0.04% | -1.45% | 0.18% | 1.52% | 0.32% | 0.59% |
| Avg | 0.91% | 0.07% | -0.14% | -0.11% | 0.37% | 1.10% |
| 1991-3 | 0.23% | 0.41% | 0.07% | -0.15% | -0.96% | -0.39% |
| 1995-3 | 0.83% | -0.21% | 0.25% | -0.17% | 0.03% | 0.74% |
| 1999-3 | 0.23% | 1.01% | -0.84% | -0.70% | 0.98% | 0.68% |
| 2003-3 | 0.31% | 1.00% | -0.64% | 0.66% | 0.02% | 1.34% |
| 2007-3 | -0.05% | -1.82% | -1.39% | 0.32% | 2.00% | -0.93% |
| Avg | 0.31% | 0.08% | -0.51% | -0.01% | 0.41% | 0.29% |
| SPX summary for Presidential Year 3 1955 - 2007 | ||||||
| Avg | 0.39% | -0.04% | -0.26% | 0.09% | 0.32% | 0.51% |
| Win% | 71% | 57% | 50% | 43% | 86% | 64% |
| SPX summary for all years 1953 - 2010 | ||||||
| Avg | 0.13% | -0.03% | -0.04% | 0.02% | 0.07% | 0.15% |
| Win% | 66% | 52% | 56% | 50% | 62% | 53% |
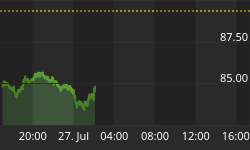
Money supply (M2)
The money supply chart was provided by Gordon Harms. M2 growth leapt higher last week.

Conclusion
A bottom appears to be in place.
I expect the major averages to be higher on Friday August 19 than they were on Friday August 12.
Last weeks positive forecast, on the expectation of a bounce, was a miss.
This report is free to anyone who wants it, so please tell your friends. They can sign up at: http://alphaim.net/signup.html. If it is not for you, reply with REMOVE in the subject line.
In his latest newsletter, Jerry Minton looks at the 3-5 year returns of the MidCap Power Index over the past thirty years. You can read "Still Going..." at www.alphaim.net and sign up for Alpha's free bi-weekly newsletter.
Thank you,


