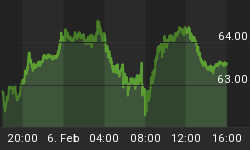
Gold has reached an all-time high well over $1900 yesterday, so the Gold bugs have reason to celebrate. Or, at least the physical gold bulls (like mr. Paulson, who is the biggest shareholder of the GLD ETF). Not the gold stock bulls: while the GLD ETF is up almost 25% since January 1st (even after the sell-off on Tuesday and Wednesday), the HUI index is actually DOWN over the same period.

![]() Larger Image - Chart created with Freestockcharts.com
Larger Image - Chart created with Freestockcharts.com
I have read many articles claiming that the underperformance of gold stocks was due to high oil prices, which increases energy costs and thus production costs of the gold mining companies. This would lead to lower profit margins.
While that sounds absolutely plausible, one should wonder what is holding gold mining stocks back, now that gold reaches new all-time highs, while oil prices have plummeted recently:

![]() Larger Image - Chart created with Freestockcharts.com
Larger Image - Chart created with Freestockcharts.com
When we then plot the ratio of the HUI-index divided by the Gold price, we get a ratio. When this ratio is rising, it means gold stocks are outperforming Gold and when the ratio is falling, it means gold stocks are underperforming gold.
Outperformance doesn't necessarily mean rising prices. It can also mean that gold stocks fall less than the gold price for instance.
What I find interesting, is that so many people are so bearish on Bank stocks, and especially Bank Of America (Ticker: BAC)
However, if you look at the ratio of the HUI-index divided by the gold price and compare this ratio to the price of BAC, don't you think they are a perfect match?

![]() Larger Image - Chart courtesy stockcharts.com
Larger Image - Chart courtesy stockcharts.com
My conclusion is that gold stocks seem to be leveraged to higher gold prices IF the general market sentiment is positive. If that's not the case, gold stocks seem to act more like equities than gold, and can sell-off no matter how high gold is trading.
For more analyses and updates, please visit Profitimes.com and follow us on Twitter!


