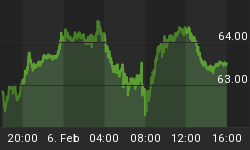
CME - S&P 500 INDEX (June) - Daily
Intermediate Trend (3 Months): Negative
Tuesday's Close: 1204.80 (-3.30)
UPDATE: Four weeks ago, at the height of hysteria/ volatility, we set out to identify the key pivot point in the Index for two reasons:
First and foremost - where would the market have to maintain support in order to "calm" the market and compress volatility? Second - at what level would the Index become attractive to investors to partially re-enter the long side; thinking there was value?
As our readers are aware, the answer based on my analysis was 1150.00. Three weeks ago as we entered the week well below that region, I stated, "If the Index could settle above 1150.00 by Friday (based on a weekly chart), it would produce a substantial buy signal."
For the past two Friday's the market settled above 1150.00, and as a result has enabled some buying confidence to re-enter the market as price action is above the 100 point congestion zone. Much more work ahead.

NYMEX - CRUDE OIL - Weekly
Intermediate Trend (3 Months): Negative
Tuesday's Close: $88.90 (+1.63 cents)
UPDATE: This may be getting old, but it continues to ring true - the direction of Stocks continues to dictate the overall direction of Energy prices (for the past few years). Recently yet another example of this dynamic- When the $&P dipped below 1100.00, Crude traded down toward $78.00, and now that the S&P has bounced over 110 points Crude has traded $12.00 higher to the $89.00 region. In addition, weeks ago, we called for a range of $82.00 to $93.00. That has been spot-on since the low three weeks ago was $82.00, and trading within the range continues. $93.00 - $95.00 represents key resistance.

NYMEX - GOLD (October) - Daily
Near Term Trend: Positive
Tuesday's Close: $1,827.50 (+34.50)
UPDATE: Following the largest single day drop since the year 1980 (down $104.00), the market hit support near the 21- Day M.A. (green) line, held, and subsequently bounced $120, recovering about 65% of the losses incurred last week. For those of you who are new to my work, an important recurring dynamic took place within the chart: If the Moving Average line is sloped in one direction for more than 15 trading days (in this case the green line has been positively sloped), and price action trades below the green line - 90% of the time the market will bounce (buyers will enter the market because those who missed the recent move wait for a dip to buy). Regardless, market can dip Wednesday.
Visit us at www.thechartlab.com for our FREE Weekly Monday Morning S&P 500 call and much more global market analysis.


