


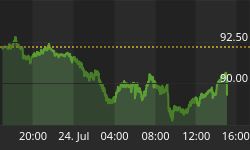


For the last week and more gold has been on a roller coaster moving between $100 and $200 each way until now where it is hovering above $1,800. A broad spectrum of analysts points to $1,500 or above $2,000. With gold currently just above $1,800 we are around the half-way point for each move. The move each way would represent a move of just over 16%, which is not deeply significant in today's gold world except for the trading fraternity; there is more, however, beneath these moves than meets the eye!
$1500 Implications
-
The fall to $1,500 is only 16%+and would therefore not represent a change of trend to us.
-
Should the fall only fall to $1,650 it would be a correction caused by significant selling in the face of rising seasonal demand.
-
A fall to $1,750 would be large buyers standing back and shaking out weak holders, who are, primarily, holding gold in the U.S. based SPDR gold ETF. They sold 50 tonnes last week.
U.S. Involvement in the Gold Market
The holders that sold gold from that ETF could be one of two types. Either a holder who took advantage of the sudden jump over $1,910 sold into strength heavily, as part of an ongoing sales program, or a broad spectrum of U.S. sellers, believing that neither inflation nor deflation is a future danger for the U.S.
Either way, buyers outside the U.S. welcomed the supply and absorbed the amount quickly. This resulted in the fall from $1,910 to $1,716 and then a race back over the $1,800 line again. The significance is that the price correction/consolidation is a movement of U.S. long-term holder's gold into central bank of Eastern demand hands.
What has been remarkable in the gold price rise is that U.S. demand for physical gold has been negligible. Compared to the original growth in the U.S. gold ETF the demand this year and last year has been modest against the initial rises in the holdings.
The behavior of the holdings has reflected not just the conservative nature of the fund but some of the investment policies of the investors. Take the holdings of George Soros. After taking his position he has decided that deflation is not a danger and has dropped his physical holdings in favor of gold shares. The switch appears reasonable in the light of the poor performance of gold shares relative to gold itself and the reality is that he did not drop his exposure to gold at all. But he remains invested in gold. The amount of buying to sell for a profit in the medium term is small and is expected to remain so. At these levels it represents less that 1% of the total investment funds in the U.S.

Why the hesitation by U.S. investors in buying physical gold? Simply put, the belief in the U.S., its economy and its monetary system is unscathed despite the debt crisis, the flow of wealth from West to East, the sagging consumer confidence in U.S. growth and the loss of confidence in the dollar. Unlike almost any other nation on earth, the patriotic attitude of U.S. investors pervades its investment world as well. Evidence of this is seen daily. Many analysts in the U.S. quite remarkably believe that gold will move on the back of U.S. economic news. We hear the media pointing to housing figures, employment figures as well as many other developed world stories as being responsible for movements in the gold price. This is puzzling because the largest percentage rises in the gold and silver prices occurred in the boom years in the U.S. from 2005 to 2007. Thereafter bad U.S. economic news saw a U.S. flight from gold and its derivatives because U.S. investors were deleveraging their positions, but then the gold price recovered largely in the absence of the U.S. investor. With so much of the developed world's gold markets being in derivatives -such as futures and options as well as gold shares--very little investment in physical gold has taken place. The notable exception is the SPDR gold ETF, together with the ishare Gold Trust, which together holds 1,700 tonnes. But this is a huge amount, larger than all bar the top four central banks in the world. So when the world looks at U.S. held gold it looks at these two entities. These holdings are relative static with recorded sales reaching around 100 tonnes in total. The traffic into gold has been largely one way with holders being long-term in nature. Whether they eventually want to sell (which means buying dollars first, then whatever else is considered the next investment opportunity next) or intend just holding because long-term that remains the safest place to hold wealth, remains to be seen. So far they have just been holders. We have to add a jump in the volume of coin and bar demand from perspicacious private investors in the U.S. over the last three years. Outside that, the U.S. is involved in physical gold through the jewelry manufacturing industry there. This industry reflects mainly the state of the wealthier end of the U.S. economy. It has almost nothing to do with a view on where the gold price is headed.
In terms of an active buying and selling of physical gold, the U.S. is a small part of the gold market and with the investment side of that participation added the size of the U.S. in the gold market is as shown in the Table we have featured in many articles [Source WGC].
Therefore a fall to $1,550 would have to be attributed to selling from the SPDR in the absence of buying from the rest of the world until that level was achieved. This is unlikely as we will show below.
Move to $2,000
What the move to $1,800 has shown reflects a much larger picture than simply a rise in the gold price. In Europe in the last three to four years there has been considerable bar and coin investing in European markets which had been pretty quiet since the seventies. Now, with a lot of that investment partly being driven by the economic problems in Europe and the problems around the euro and sovereign debt countries in the Eurozone, this demand continues -investment demand as a result of the crises the developed world faces. It must be said emphatically, that both Indian and Chinese demand has nothing to do with the reactions to the developed world crises and everything to do with financial security. Yes, fear of inflation is an accelerant to gold buying but not the driver developed world investors believe. Asian buyers are not traders, not profit-seekers but seek financial security for those rainy days, much like central bank buyers. This is the driving force behind the rise in gold price.
Even on the ETF side these attitudes are now pervading. When they were first launched they allowed a change in U.S. gold accessibility. Gold was relatively inaccessible for professional investors until the ETFs were brought to market in 2002 to 2004 at which point, instead of paying up to 7% to get a position in gold, they could now pay as little as 1% and buy into the liquidity that came with large positions in the gold market. Now as the attitude to gold as an investment is changing, demand for the shares of the ETFs is coming from private wealth organizations, asset managers, and global macro funds. Professional investors -not just high net worth and private wealth investors--are seeing gold as a useful foundation asset and hedge against depreciation of currencies as gold is in a sense a currency itself.
In the absence of ETF gold selling in the U.S. the weight of demand for reasons other than hedging against developed world financial problems is heavy, long-term and relatively price insensitive. So a move to $2,000 would validate that conclusion and not be the result of some spectacular drama.
Gold's Fundamentals
The gold price is moving because of the fundamental factor not because of the dramas of the day in the developed world's monetary system. The media has to overlook this because each day in their lives demands another story that's dramatic enough to get you to read it. This throws up a fog that hides the more boring day to day realities. Over a longer term these factors are as dramatic as the gold price rise since 2005.
The 'Gold Season'
May to the end of August is the time that the gold market is quiet. Like that patch of sea between Africa and South America where the trade winds don't blow it is called the doldrums. What a spectacular doldrum we've had. It felt more like a hurricane to the gold price! But now that we are sitting in September and the Trade winds are adding to the winds that are still blowing. In emerging Asia too, that hurricane was a halting of the doldrums, a change in the seasonal patterns due to the emergence of China and the burgeoning of Asian middle classes that have overruled the agricultural influences of India's gold market.
In this quarter we are also seeing an increase in bar and coin demand which is being driven by inflation. This is NOT a substitution for jewelry. Jewelry was up 17% in India and China in this quarter and both countries were up substantially in terms of total demand -India up 38% and China up 25%. India off a higher tonnage number grew faster in this quarter than did China and so we don't see India giving up its number one position soon.
This year probably puts to rest the concept of gold having a doldrums between May and June. How more definite could that be stated than the gold price hitting record levels during that time! What we should now focus on is that from September onward, demand jumps because of jewelry manufacturing in the developed world and the festival season in India overlaid with growing investment demand on a non-seasonal basis.
Central Bank Buying & Which way will it go?
For Subscribers Only. Subscribe through GoldForecaster.com and SilverForecaster.com


