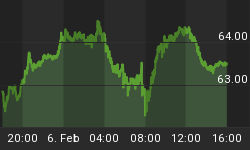
A member highlighted this stock and we concur it looks like it is ready to swing on the next change in risk attitude.
The chart you see is our RTT VolumeWave chart. Showing off price waves with cumulative volume for each, this is a Wyckoff measure. You want to see rising prices on rising volume and falling prices on less volume for a bullish case.
The chart is not that great, not very good Gann Angle support, so it has to be consider at tad risky.
The bullish price wave at (1) had moderate volume (good enough), but the bullish price wave at (2) was not supported and obviously some bulls just gave up and caused (3). The bearish price swing down on (3) is so far on very light volume (no conviction yet), and we would expect a short basing period and then the bulls to take advantage of current low prices, just prior to a swing up.
Also note the ABC swing down on the daily chart from Oct. Please put this on your watch list.


