• 1,049 days Will The ECB Continue To Hike Rates?
  • 1,049 days Forbes: Aramco Remains Largest Company In The Middle East
  • 1,051 days Caltech Scientists Succesfully Beam Back Solar Power From Space
  • 1,451 days Could Crypto Overtake Traditional Investment?
  • 1,456 days Americans Still Quitting Jobs At Record Pace
  • 1,458 days FinTech Startups Tapping VC Money for ‘Immigrant Banking’
  • 1,461 days Is The Dollar Too Strong?
  • 1,461 days Big Tech Disappoints Investors on Earnings Calls
  • 1,462 days Fear And Celebration On Twitter as Musk Takes The Reins
  • 1,464 days China Is Quietly Trying To Distance Itself From Russia
  • 1,464 days Tech and Internet Giants’ Earnings In Focus After Netflix’s Stinker
  • 1,468 days Crypto Investors Won Big In 2021
  • 1,468 days The ‘Metaverse’ Economy Could be Worth $13 Trillion By 2030
  • 1,469 days Food Prices Are Skyrocketing As Putin’s War Persists
  • 1,471 days Pentagon Resignations Illustrate Our ‘Commercial’ Defense Dilemma
  • 1,472 days US Banks Shrug off Nearly $15 Billion In Russian Write-Offs
  • 1,475 days Cannabis Stocks in Holding Pattern Despite Positive Momentum
  • 1,476 days Is Musk A Bastion Of Free Speech Or Will His Absolutist Stance Backfire?
  • 1,476 days Two ETFs That Could Hedge Against Extreme Market Volatility
  • 1,478 days Are NFTs About To Take Over Gaming?
Another Retail Giant Bites The Dust

Another Retail Giant Bites The Dust

Forever 21 filed for Chapter…

Market Sentiment At Its Lowest In 10 Months

Market Sentiment At Its Lowest In 10 Months

Stocks sold off last week…

The Problem With Modern Monetary Theory

The Problem With Modern Monetary Theory

Modern monetary theory has been…

  1. Home
  2. Markets
  3. Other

The State of the Trend

The pre-market gap down on Monday gave a strong indication that the congestion phase has ended, and a new multi-week downswing is beginning.

In the process, the SP500 closed within a couple of points of the 1164 support level identified last week-end by OddsTrader app. The new targets are 1140 and 1125, while the pivot line is at 1205.

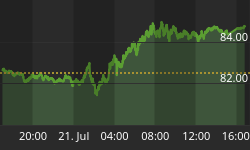
Judging by the attached chart, the down leg could last until the end of December:

S&P Weekly Chart
Larger Image

As one would expect, this is accompanied by further deterioration in bullish sentiment, with plenty of room to go to the downside:

SP500 vs Intensity
Larger Image


Back to homepage

Leave a comment

Leave a comment