


WAVE 3 OR CORRECTIVE WAVE B?
Precision timing for all time frames through a 3-dimensional approach to technical
analysis: Cycles - Breadth - P&F and Fibonacci price projections
"By the Law of Periodical Repetition, everything which has happened once must happen again, and again, and again -- and not capriciously, but at regular periods, and each thing in its own period, not another's, and each obeying its own law... The same Nature which delights in periodical repetition in the sky is the Nature which orders the affairs of the earth. Let us not underrate the value of that hint." ~ Mark Twain
Current Position of the Market
SPX: Very Long-term trend - The very-long-term cycles are down and, if they make their lows when expected, there will be another steep and prolonged decline into 2014.
SPX: Intermediate trend - An top was made at 1292. Future action will tell us if this is a resumption of the bear market, or another corrective wave.
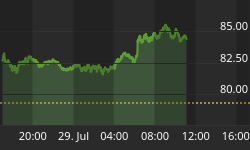
Analysis of the short-term trend is done on a daily basis with the help of hourly charts. It is an important adjunct to the analysis of daily and weekly charts which discusses the course of longer market trends.
Market Overview
The 1292 top may be turning out to be an intermediate top instead of a short-term top. After some distribution between 1260 and 1292, the SPX began a decline which has yet to reverse, even on a near-term basis. Each small down-wave concluded with a brief period of re-distribution followed by the next one down. This process has created a series of lower highs and lower lows which has yet to be reversed.
There were minor signs of deceleration in the trend, and even some positive divergence on Friday. As you will see, this is reflected in the hourly chart indicators, and this is always a precursor to some sort of reversal. In addition, there was an interim P&F projection to 1160 which was met and re-tested on Friday. It also looks as if a 5-wave interim pattern may have been completed at the close of the day, or could extend for another day or two to the next interim projection closer to 1150. This combination of factors suggests an imminent near-term reversal.
Assuming that we do get it, how close to a low are we for the entire decline? Perhaps fairly close, or perhaps very far. Let me explain! We know that a severe decline is due to occur into the low of the 120-wk cycle and its components -- most likely in October of 2014. Has it already started? Or do we need more preparation before it gets under way? This is what the market will tell us over the next few weeks. The structure suggests that we are either in a 3rd wave from 1370, or that we are making a corrective wave, followed by another rally before continuing lower.
The distribution pattern across 1257consists of three phases which are very distinct from one another. The SPX is in the process of completing the first phase of that pattern which has a projection of about 1137. If we stop there and start a good rebound, it is possible that we have only completed a "C" wave from 1192 (as well as a "B" wave from 1075), and that we can now mount a 5-wave rally to complete a bigger "C" wave which would also be wave 2. If we go beyond 1137, it will then be likely that we are indeed already in wave 3 from 1370, and then the SPX could continue to at least 834 before finding a good low.
There are some difficulties with that second interpretation, and one of them is the time factor. We are still three years away from the projected October 2014 major cycle low. Starting a wave 3 right now feels as if it would get to the bottom of the decline too soon, unless we have a wave 4 which is a couple of years long. It would be more logical to start a C wave from about 1137 and kill some more time making wave 2.
These are some of the possibilities for the long-term market structure. The next few weeks should clarify it. In the meantime, let's look at the charts to see when and where we might find our first decent rally.
Chart analysis
We'll start with the SPX Daily Chart. I have traced out the two possibilities. The recent top at 1192 is either Wave 2 from the 1370 top, or the "A" wave of a corrective pattern with the "B" nearly complete.

The indicators are not very helpful at telling us which it is, since the structure on the downside will not be complete for a few more days. For now, they are just oversold.
I marked the 1137 P&F projection on the chart. If it turns out to be the low, it would be the equivalent of a .707 retracement for the entire decline. If, by then, the indicators are in a good position to give a buy signal, and we turn up with good strength and follow-through, the odds will increase that we are making a "C" wave and are not yet in wave 3.
Let's now take a closer look at the structure of the down-wave on the Hourly Chart. I have labeled the structure of the down-wave. We'll see how close it comes to being correct. The 1137 projection is also marked. If my expectation that we are about to make a (blue) wave 4 is correct, the P&F pattern that we make during this move should give us a confirmation to the 1137 count. If we don't do what is expected here, I'll have to adjust to the new pattern and analyze its meaning.

There are indications that we are (finally) about to have a near-term reversal. If we start up on Monday, we could get up to about 1195, which is the level of the previous (green) wave 4 and close to a .382 retracement of the down-wave which started from 1267. If we go lower first, the count may change.
You can see that this is the first time, throughout the entire decline, that meaningful positive divergence is showing in the indictors, particularly in the A/D (bottom) and the MACD. That should soon usher in a reversal of short duration. In order to get something more substantial, we'll have to wait until the daily indicators are showing more readiness.
Cycles
Monday/Tuesday could be a cyclical low, which would fit nicely with the pattern which I have traced out on the chart; even better if the low came in the last hour on Friday.
The 14/15-wk high to high cycle, which has been so consistent since the beginning of the Bull market of 2009, is due in the second week of December. This would be in perfect sync with the anticipated wave 4 that I have marked on the chart (the notation on the chart is not necessarily in the right time slot).
Breadth
The NYSE Summation Index (courtesy of StockCharts.com) has held well, remaining positive above both MAs, and retracing less ground than the price. If its action continues to be positive while the SPX makes a low at 1137, we'll have to consider the possibility that a "C" wave is in place.
The RSI has reached oversold and could be ready to turn up in a few days.

Sentiment
The SentimenTrader (courtesy of same) is showing some notable improvement since the reading of a week ago. The short-term indicator is firmly in the green and, more importantly, the long-term indicator has returned to the green -- a neutral position with a slight bullish bias.

The VIX
I discussed the VIX thoroughly last week, but it is worth taking a look at the chart once again because, if the index was giving some bullish indications then, it is even more bullish this week.
Since breaking below the 1215 support level, the SPX has dropped another 57 points. On the VIX, the 1215 level corresponds to 36.46. If the VIX were confirming the drop in the indices, it should be trading proportionally higher than 36.46 in order to match the decline in the SPX. Instead, it closed at 34.47 on Friday. Clearly, it is trying to say something about the current market move.
If you believe in the predictive value of the VIX, you have to pay attention!

BONDS (TLT)
The first chart is a Point & Figure chart of Barclay's Treasury Bond Fund (courtesy of StockCharts.com), which is widely followed as an indicator of bond price movements. Because it charts extremely well, it also counts very well, which makes the projections derived from this chart highly predictable. Below the P&F chart is a bar chart of the index. By analyzing the two charts, we can get a better feel for what the index is doing and, consequently, what the equity market is doing.
The index broke out of a base of consolidation which is highly visible on both charts. The small section of the base is marked on the bar chart in dark green; the entire base in light green. You can see that the index went directly for the entire base count of 126. That corresponded to the decline from 1356 in the SPX. TLT came just short of its 126 projection and started to retrace at the same time that SPX reached 1075 and rallied. When the SPX started to decline once again, TLT started to move up. By analyzing the Point & Figure charts of both indices, we can derive some meaningful projections about the extent of their current move.


TLT is easier to analyze than the SPX because its rally base is better defined. It is either making a wave 5 which will result in a new high of 132, or simply making an ABC wave 4 corrective move, with the B wave already having reached its 123 projection. The fact that it retraced immediately after reaching that level on Wednesday suggests that the latter is probably the correct count. To confirm, it must now continue to correct.
On the bar chart, the MSO is almost overbought and could still move higher, but the MACD looks weak and ready to reverse. It will take another few days to confirm the move that this index is making, but since it is one of the best contrary indicators, if its structure takes the appearance of an ABC corrective wave 4, it will be a strong indication that this is what the SPX is likely to do as well.
Summary
After a vicious and relentless decline of 108 points, the SPX is finally showing some early signs of deceleration - meaning decreased selling and more buying -- mixed with minor positive divergence in the intraday indicators. Since this corresponds to a potential interim structure completion, chances are that we are beginning to see early signs of a near-term trend reversal.
If the short-term structure count that I have shown is correct, we should get a minor rally followed by a final low in the vicinity of 1138. The larger structure suggests that this may be the end of the C wave from 1292 as well as a B wave from 1075 and that, in a few days, the SPX should be ready for its final rally before a larger decline takes hold.
This possibility is supported by action in the VIX and TLT. The dollar will have to confirm as well but it is not quite ready. We will analyze it in the next newsletter.
FREE TRIAL SUBSCRIPTON
If precision in market timing for all time frames is something which is important to you, you should consider a trial subscription to my service. It is free, and you will have four weeks to evaluate its worth.
For a FREE 4-week trial. Send an email to: ajg@cybertrails.com
For further subscription options, payment plans, and for important general information, I encourage you to visit my website at www.marketurningpoints.com. It contains summaries of my background, my investment and trading strategies and my unique method of intra-day communication with subscribers. I have also started an archive of former newsletters.


