12/7/2011 8:52:59 AM
Another day passes with little change to U.S. equities....
Recommendation:
Take no action.
Click here to access our stock market chat rooms today! For a limited time, try our chat room for free. No subscription necessary to give it a try.
Stock Market Trends:

- ETF Positions indicated as Green are Long ETF positions and those indicated as Red are short positions.
- The State of the stock market is used to determine how you should trade. A trending market can ignore support and resistance levels and maintain its direction longer than most traders think it will.
The BIAS is used to determine how aggressive or defensive you should be with an ETF position. If the BIAS is Bullish but the stock market is in a Trading state, you might enter a short trade to take advantage of a reversal off of resistance. The BIAS tells you to exit that ETF trade on "weaker" signals than you might otherwise trade on as the stock market is predisposed to move in the direction of BIAS.
- At Risk is generally neutral represented by "-". When it is "Bullish" or "Bearish" it warns of a potential change in the BIAS.
- The Moving Averages are noted as they are important signposts used by the Chartists community in determining the relative health of the markets.
Best ETFs to buy now (current positions):
Long DIA at $118.96
Long QQQ at $57.40
Long SPY at $124.79
Click here to learn more about my services and for our ETF Trend Trading.
Value Portfolio:
Daily Trading Action
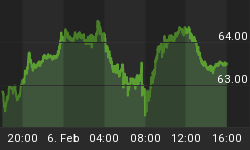
The major indexes opened flat and then dipped in the first fifteen minutes and then moved in mixed directions. The Dow outperformed all day making a saw-tooth wave pattern than moved higher until the final forty five minutes saw the Dow close with less than one half of one percent in gains. The S&P-500 gyrated around but effectively moved sideways until it began to move higher after the lunch hour but it too succumbed to selling pressure in the final forty-five minutes and ended the day little changed. The NASDAQ-100 actually moved lower through the morning before stalling and eventually rallying fairly strongly in the mid-afternoon but it too succumbed to selling pressure in the final forty-five minutes and closed with a small fractional loss. The semiconductor index (SOX 377.41 -0.71) eased modestly but stayed above its 20-Day Moving Average (DMA). The Russell 2000 (IWM 74.83 +0.07) tacked on a modest gain while hinting it is slowly shifting toward a BULLISH BIAS. Of all the equity indexes, it appears most ready to correct downward by Wednesday. The Dow Jones Transport Index (IYT 89.08 -0.75) slid to a large fractional loss after it opened at and moved down from its 200-DMA. The Bank index (KBE 19.52 -0.19) fell essentially one percent and shifted into an uptrend state. The Regional Bank Index (KRE 23.82 -0.22) also lost essentially one percent falling back below its 200-DMA while maintaining its uptrend state and BULLISH BIAS. The Finance Sector ETF (XLF 13.18 +0.01) closed essentially flat maintaining its uptrend state and leading toward a move to a BULLISH BIAS but not there yet. All equity indexes we regularly monitor have shifted into uptrend states with the exceptions of the semiconductor index and the bank index, which are in trading states. Equity indexes that we regularly monitor currently have a BEARISH BIAS with the exception of the Regional Bank Index and the Dow Jones Transport Index. Long term bonds (TLT 117.27 -1.13) slid nearly one percent as longer term bonds appear to be starting their next leg lower. TLT remains in a trading state and retains its BULLISH BIAS. Trading volume was light 802M shares traded on the NYSE and with 1.320B shares traded on the NASDAQ.
There were no economic reports released. With a lack of catalysts, this essentially left equities to fumble around a bit, appearing to walk in place.
The U.S. dollar fell nearly one tenth of one percent possibly indicating the start of the next leg lower.
Seven out of ten economic sectors in the S&P-500 moved higher with Tech unchanged. In order of gains, the bullish sectors were: Materials +0.8%, Health Care +0.5%, Telecom +0.3%, Consumer Staples +0.2%, Utilities +0.2%, Industrials +0.2%, and Energy +0.1%. Financials -0.1% and Consumer Discretionary -0.2% were the bearish sectors.
The yield for the 10-year note rose four basis points to close at 2.09. The price of the near term futures contract for a barrel of crude oil gained twenty-nine cents to close at $101.28.
Implied volatility for the S&P-500 (VIX 28.13 +0.29) gained one percent and the implied volatility for the NASDAQ-100 (VXN 27.94 +0.05) tacked on a minor gain.
Market internals were mixed with advancers edging decliners on the NYSE while decliners outnumber advancers 5:4 on the NASDAQ. Down volume edged up volume on the NYSE and by a more significant 3:2 on the NASDAQ. The index put/call ratio fell -0.27 to 0.92. The equity put/call ratio rose 0.07 to close at 0.76.
Conclusion/Commentary
Tuesday saw very little difference in equity prices by the time the market closed. Most economic sectors moved higher but we are concerned that internal indicators were more bearish than bullish. We have been expecting a pull-back in the markets before the next solid advance is possible and we continue to wait for that set-up.
The most obvious area to look at is the 200-Day Moving Averages. The S&P-500, Dow Jones Transport Index, and the Regional Bank Index all have reversed there and closed below those important levels. This likely sets up the move lower we have been anticipating. This sets up agile traders to take advantage of such a scenario.
Since we are not in the practice of trading into and out of positions in such a manner, we will try to hold through any pull-back. Stay tuned.
We hope you have enjoyed this edition of the McMillan portfolio. You may send comments to mark@stockbarometer.com.


