


12/12/2011 9:06:40 AM
Quants believe the market can be mathematically modeled and ineffiencies exploited.
As a mechanical engineer you pretty much minor in math as engineering and match go hand in hand. So needless to say, trying to model the market came pretty natural to me. I've been doing it over 10 years now and have made some pretty historic calls on the market. And some not so historic ones...
I do believe a component of market action is random, and I also believe that even in random markets, inefficiencies are created that can be exploited. I also believe that the markets are so big, that there are opportunities all over the place, and usually in the places that no one is looking. Once everyone knows about an opportunity, it's usually over - and the efficient market hypothesis takes over.
The barometer is one such attempt to mathematically model the market. My data base has almost 200 different views on monitoring such efficiencies - trying to identify inefficiencies.
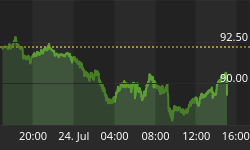
Big picture, the dollar is cranking this am on Euro weakness. It's moving to retest highs. Bonds are not as strong, remaining in their current consolidation. I still see the bond action as dominating. If we get a head and shoulder type action in bonds, the stock market will hold lows here and will break higher. No doubt about it.
We're also in a Monday morning of options expiration week. So the am action is worisome, but the more important thing is how the market closes. We have a big week on an economic report basis.
Here's a look at the global markets:

On the economic front, here is the schedule for this week. Pay close attention to the timing of the report and the potential for the markets to make short term reversals at those points.

On to the charts:

Stock Barometer Analysis
We remain in Buy Mode as the barometer bounced and the market held the 9dma. Markets seem a little out of balance this Monday am, suggesting we'll test lower levels. And the key is whether prices stick or not.
The Stock Barometer is my proprietary market timing system. The direction, slope and level of the Stock Barometer determine our outlook. For example, if the barometer line is moving down, we are in Sell Mode. A Buy or Sell Signal is triggered when the indicator clearly changes direction. Trend and support can override the barometer signals.
Money Management & Stops
To trade this system, there are a few things you need to know and address to control your risk:
- This system targets intermediate term moves, of which even in the best years, there are usually only up to 7 profitable intermediate term moves, of which even in the best years, there are usually only up to 7 profitable intermediate term moves. The rest of the year will be consolidating moves where this system will experience small losses and gains that offset each other.
- This system will usually result in losing trades more than 50% of the time, even in our best years. The key is being positioned properly for longer term moves when they come.
- Therefore it is vitally important that you apply some form of money management to protect your capital.
- Trading a leveraged index fund will result in more risk, since you cannot set stops and you cannot get out intraday.
Accordingly;
- Make sure you set your stops so that you can lose no more than 2% per trade (based on the QQQQ if you're trading leveraged funds and options with our trading service).
Potential Cycle Reversal Dates
2011 Potential Reversal Dates: 1/15, 1/29, 2/16, 3/10, 3/18, 4/6, 5/21, 5/31, 6/13, 6/24, 7/16, 8/1, 8/19, 9/4, 9/25, 10/21, 10/25, 11/25, 12/26. We publish dates up to 2 months in advance.
With our next key reversal date as 12/26, we generally would look for the markets to move higher into this period. Recent action makes that very curious - will we see a consolidation move sideways of big up days and doen days or will a trend take hold? That's the question of the day...
My Additional timing work is based on numerous cycles and has resulted in the above potential reversal dates. These are not to be confused with the barometer signals or cycle times. However, due to their past accuracy I post the dates here.
2010 Potential Reversal Dates: 1/19, 1/28, 3/2, 3/23, 4/7, 5/30, 6/10, 6/28, 7/10, 8/13, 9/7, 10/2, 10/27, 11/21, 12/19. We publish dates up to 2 months in advance. 2009 Published Reversal Dates: 1/20, 2/11, 3/7, 3/15, 4/8, 4/16, 4/27, 5/7, 6/8, 7/2, 7/17, 9/14, 10/10, 10/24, 11/12, 11/30, 12/9, 12/21, 12/29. 2008 Potential Reversal Dates: 12/31, 1/11, 2/1, 2/13, 3/6, 4/5, 4/22, 5/23, 6/6, 6/27, 7/13, 9/2, 10/3, 10/22, 11/10, 12/11. 2007 Potential Reversal Dates: 1/10, 1/14, 1/27, 1/31, 2/3, 2/17, 3/10, 3/24, 4/21, 5/6, 6/15, 8/29, 10/19, 11/29, 12/13, 12/23, 12/31, 1/11/08. 2006 potential reversal dates: 1/16, 1/30, 2/25, 3/19, 4/8, 5/8, 5/19, 6/6(20), 7/24, 8/20, 8/29, 9/15, 10/11, 11/28. 2005 Potential reversal dates: 12/27, 1/25, 2/16, 3/4, 3/14, 3/29, 4/5, 4/19, 5/2, 6/3, 6/10, 7/13, 7/28, 8/12, 8/30-31, 9/22, 10/4, 11/15, 11/20, 12/16.
Timing Indicators
Use the following Timing/momentum indicators to assist in your trading of the QQQQ, GLD, USD, USO and TLT. They are tuned to deliver signals in line with the Stock Barometer and we use them only in determining our overall outlook for the market and for pinpointing market reversals. The level, direction, and position to the zero line are keys in these indicators. For example, direction determines mode and a buy signal 'above zero' is more bullish than a buy signal 'below zero'.
QQQQ Timing Indicator (NASDAQ:QQQQ)

The QQQQ Spread Indicator will yield its own buy and sell signals that may be different from the Stock Barometer. It's meant to give us an idea of the next turn in the market.
Gold Timing Indicator (AMEX:GLD)

Want to trade Gold? Use our signals with the Gold ETF AMEX:GLD. Gold gives us a general gage to the overall health of the US Economy and the markets.
US Dollar Index Timing Indicator (INDEX:DXY)

Want to trade the US Dollar? Use our signals with the Power Shares AMEX:UUP: US Dollar Index Bullish Fund and AMEX:UDN: US Dollar Index Bearish Fund.
Bonds Timing Indicator (AMEX:TLT)

Want to trade Bonds? Use our signals with Lehman?s 20 year ETF AMEX:TLT. The direction of bonds has an impact on the stock market. Normally, as bonds go down, stocks will go up and as bonds go up, stocks will go down.
OIL Timing Indicator (AMEX:USO)

Want to trade OIL? Use our signals with AMEX:USO, the OIL ETF. We look at the price of oil as its level and direction has an impact on the stock market.
Secondary Stock Market Timing Indicator

We daily monitor hundreds of popular and proprietary technical indicators that break down market internals, sentiment and money flow to give us unique insight into the market. We feature at least one here each day in support of our current outlook.
As an annual subscriber to any of our premium services, you also get access to all our charts and research. Email Carl@stockbarometer.com to upgrade and also save 20% on your subscription.
Daily Stock Market Outlook
We remain in Buy Mode. We're seeing a cross current of large up days and down days. The key is waiting to see which trend will dominate. I believe the selling will be shortlived - ending today or tomorrow and rallying into year end. Markets are gapping strong in one direction. I'd look for and bet on a reversal.
The above immage of the ECRI shows that the economy, while negative, is still improving. This is more of a big picture indicator.
What about oil? Here's an ominous sign:

My view on oil is getting more bearish - which concerns me about the overall market - as there is a correlation - with oil generally following the stock markets. The key is the dollar. If the dollar and stocks can go up together, and have oil go lower - that would be a very bullish scenario...
My view on bonds is bearish overall - and even though they're rallying this morning, they'll remain in the current pattern and reverse lower.
As I showed you last week, I'm still bearish on Gold. It needs to do a bit more before I'd be a buyer. It's getting hit hard this am. Very hard! All the way down to the previous expiration lows interestingly enough...
One such potentially bullish sign is the level of overall equity option buying of puts:

Relatively speaking, the overall level is approaching bullish levels (and should be at a reversal level on today's weakness). The key is when this energy will release - like a rubber band springing back. Based on this, we're within a day of that occurring - but also up to 5 days away. So also a reason to be cautious going into this Friday's quadrouple expiration...
If you want to learn more about some of these indicators, I use my blog to cover them in more detail.
If you're looking for more information, please visit our blog - I'll have updates and publish other articles there. http://investmentresearchgroup.com/Blog/
Regards,


