GOLD
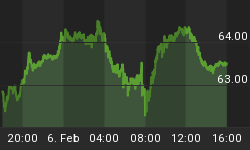
First What Happened on the day of ECB head Mario Draghi's Press Conference on 12/8/2011. What we see is how this speech caused, a very predictable reaction from traders. Sequence of this was.
- PUMP to DHAP3( Daily High Attraction Point, TM-Antisopitalist)
- DUMP to DLAP3( Daily Low Attraction Point. TM-Antisopitalist)
This has started an avalanche of 200 point drop since then. You be the judge, how the world works. For us it is important that we can anticipate those events, as these levels were known more than few hours/days ahead of the time. This is what our Tailored Services provide, day in and day out. Attraction Points at all time-frames from hours to Millennium( Someone is going to be living that long(:-, we hope).
Well, that was the fast. Now, to the future. The chart above is another one of our proprietary pressure indicators, that we call Pressure Chart( these are available for many major sectors of the market). As you can see our indicator has been pretty astute in finding out the good places to look for buy and sell situations. All oscillators here are inverse related to the price. That is when the oscillators are high, the buy pressure is high and gold prices are low and when the oscillators are low the sell pressure is high. So, a simple observation here is that, at least, in the short term, gold buy pressure is high, perhaps even HUGE. Expect a dead cat bounce. Another simple visual observation would tell us that the decline from the top has, now, traced an ABC correction down. Please be sure to use other short term indicators for good entry point, but you are assured with this graph that , for now, the market is more likely to rally than decline.
Those that would like to know how we trade the incredible lineups of DAILY/INTRA-DAY/YEARLY Attraction Points can subscribe to our individual services - TAILORED-Offer.
We are http://borisc.blogspot.com are dedicated to helping you, "little guy" understand how the investment world works and will answer any questions FREE related to the financial markets. Why? Because as SHOTA RUSTAVELY Great Georgian, 12 Century Poet and Philosopher said:
"You Find What You Give, All Else Is Lost"


