


SPX is arriving at an important crossroad with a 3 -wave up leg off last Monday's lod.
Price behaviour into year-end will finally bring some "light" as we will be able to increase the confidence on one of the potential EW patterns that in my opinion are the best candidates to define the muddy price structure that price is unfolding from the October 4 low.
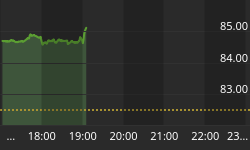
Yesterday price reached a potential target for the third wave up off Monday's lod at the 0.618 extension with a potential ending pattern. Hence if the small ED is correct we should expect at least a short-term pause.
A 3-wave up leg, barring an improbable extension higher, can either be a corrective ABC up or the initial stages of an impulsive up leg.
Therefore now we have a key level to watch at 1242.82 since, if in the next pullback price breaches this "price marker" the overlap will kill the project of an impulsive wave (C) up.

So lets review the 3 options that I have been discussing:
- If price does not overlap:
The most likely scenario will be the impulsive wave (C) up.
This option has an equality extension target at 1377

- If price does overlap:
- Triangle wave (B):
Price should fail to overcome the 200 d = 1259.50 with a wave (b) of (C)
And maintain a contracting structure until the wave (E) is in place
If price breaches the assumed wave (A) lod at 1158.67 this option will be killed.

- Double ZZ wave (B)
Price should reverse at the trend line that connects the October & December peak followed by a "scary" and deep impulsive down leg that will bottom above the October 4 low, maybe shaping a bullish flag.

In the bigger picture time frame we can see that any bullish idea MUST achieve to break above the 200 d and the huge downtrend line resistance in order to knock out the "obvious" bearish channel.
If this obstacle is removed then the "bearish" wave (B/X) could top anywhere in the range 1320-1377

In the technical front we have an improvement of momentum and breadth indicators:
- Momentum: we have new bullish crosses of Stochastic and MACD with the RSI back above the 50 line. But both the MACD and the RSI MUST break above their trend lines.

- NYSE BPI : we have a new bullish cross.

- Weekly Summation Index: we have a potential bullish cross.

As mentioned yesterday VIX is warning that a pullback is due. Yesterday it closed with a Doji below the lower BB of the envelope (20.20). A potential mean reversion would have a target in the area of 26.80 if the 200 d at 25.73 were breached.

And lastly I wish you a wonderful Merry Christmas and all the best for the New Year.
I will be back on January 6


