


If there is one lesson to be learned from the Japanese experience with deleveraging over the past few decades it's that deleveraging cycles have there own special rhythm of reflationary and deflationary interludes. Pretty simple thinking as balance sheet deleveraging by definition cannot be a short term process given the prior decades required to build up the leverage accumulated in any economic/financial system. If deleveraging were a short term process, it would play out as a massive short term depression. And clearly any central bank would act to disallow such an outcome, exactly has been the case not only in Japan over the last few decades, but now also in the US and the Eurozone. We just need to remember that this is a dance. There is an ebb and flow to the greater (generational) deleveraging cycle. Just as leveraging up was not a linear process, neither will the process of deleveraging be linear. Why bring this larger picture cycle rhythm up right now? The recent price volatility we've seen in assets that can be characterized as offering purchasing power protection within the context of a global central banking community debasing currencies as their preferred method of reflation for now, specifically recent the price volatility of gold.
Time to step back and have a look at the "rhythm" of gold over the last decade to hopefully provide perspective on not only the price of gold itself, but really on the character of the deleveraging cycle. We've experienced quite the nasty price correction in gold as of late. Is it really that Euro banks have been either liquidating or accelerating gold leasing in order to raise precious capital? Sure could be. We've also had a lot of recent converts to precious metals given the prior 25%+ two month run in prices we saw earlier this year. As is usually the case, the market gods need to teach these folks a lesson and separate the traders from the real investors. That's more than well underway.
We've always maintained that THE most important activity we face each and every day, especially in the tech supercharged multi-media world of the moment, is separating white noise from meaningful information. If we had to guess, 90% of daily Wall Street "commentary and analysis" is white noise. It's hot air. And maybe that number should be much closer to 100%. So, one of the noisy drumbeats that has resurfaced as of late is that "it's over for gold now that it has pierced its technically important 200 day moving average to the downside". Fact, gold pierced its 200 day moving average to the downside in seven of the last nine years (inclusive of 2011). This is far from some rare occurrence. Far from. In fact the only two years of the last nine not to witness this technical break were 2009 and 2010 - the two years in which we witnessed the US Fed print the largest amount of money on record.

For now, the thinking that gold's break of the 200 day moving average is the sure sign of bull market death is white noise.
Although this is just our own personal interpretation, at least over the last three years gold has not only reacted to central bank monetary largesse, but it has done a great job of anticipation of the very same. The following chart documents gold since 2009. We've marked the periods where the Fed started up the quantitative easing (QE) process in 2009 and 2010. Notice the rallies in gold prior to each QE initiation? In each case gold anticipated the event a number of months in advance and actually corrected a bit when the process finally started. The short term "buy the rumor and sell the news" type of trading behavior? You bet. Question, was the large run in gold this year over the June through August time frame strong anticipation of a European Central Bank (ECB) money print that simply has not arrived quite yet? Moreover, was the run back up in price into late October from the spike September lows again anticipation that the ECB would commit to QE in the Euro "summit" and subsequent late October "fix it" proclamation? With investors ultimately disappointed in no immediate money print/currency debasement, we now find ourselves in corrective mode once again. Sound reasonable in terms of short term price rhythm? Hopefully keeping it simple makes sense.

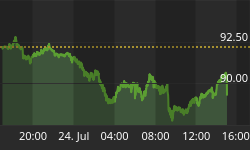
If we look at the intraday highs and lows in gold since August of this year through last Friday, we find that the metal has experienced a so far top to bottom price correction of just over $360. This is the largest nominal dollar per ounce correction since the gold bull began in 2001!! In nominal dollars per ounce it even eclipses the 2008-2009 price correction, which was one nasty price decline. So naturally it feels bad and can easily trigger quite the emotional response. But I'd suggest to you it should be expected as gold has moved to ever higher nominal prices in its bull market journey so far. And "journey" we would highlight as a key character point.
In top to bottom percentage movement terms, the correction in gold we've seen so far just happens to be almost smack dab in the middle of top to interim bottom percentage price corrections we've seen in gold since the decade of the 2000's began, as is documented in the next chart. And this is the definitive end to the gold bull market? Noise, for now.

If we were to witness gold drop in a percentage magnitude similar to what we witnessed during the 2008-09 correction, we'd be looking at something near a $1,350 low. If that were to occur, the short term "bull market is over" noise would simply be deafening.
We know we're talking to ourselves primarily, but we need to remain open to multiple outcomes at any point time. An ongoing truism, at the very least simply to retain our sanity and allow non-emotional forward decision making. As we always tell clients, we need to hope for the best, but plan for the worst. After all, it's all about risk management in this wonderful world. So from this contextual standpoint, a few realities that might not seem so pleasant, but need to be part of ongoing monitoring and decision making. We think it's important to have a look at data point anecdotes we've seen in prior gold bull cycle corrections. Specifically, let's have a look at the fingerprints of Bollinger Band experience in prior gold price corrections. To the point, as is seen in the chart below, when gold has met up with the lower portion of the weekly Bollinger Bands over the last decade, the first "touch" of the lower band was not the last. Gold has tended to "ride" the lower band for a while before again resuming flight after a needed breather. Over the last few weeks we've now experienced the first "touch". Although there are zero guarantees here, the history of the gold bull tells us to anticipate one or a few more testing "touches" of the lower band. And that may certainly mean lower prices will be probed as gold tests for an interim bottom in its ongoing price journey. It feels weird right now because we have not had this experience in two and one half years - the longest stretch yet in which gold has avoided an encounter with the lower weekly Bollinger band.

Again, although this is strictly our own personal interpretation, just how low could the price of gold descend in an absolutely worst case scenario? What lies below may seem shocking, but hopefully will become a bit clearer in looking at the chart after this. Below are what we consider to be very important total bull market price levels. Shocked yet? If gold ever corrected to the lower level near 1050, we'd personally be stunned if there were even one gold bull left on planet Earth! But it's all within the realm of potential outlier possibility. Do we actually think this will happen? Personally, no, but our personal thinking is not what's important. It's planning for a range of market outcomes and developing a plan around each that's so important to the total investment process. This is clearly an extreme potential outcome.

But what forces us to at least consider extremes is what you see below that are two critical longer term technical trend lines for the current gold bull market. Again, the gold community would probably be catatonic if we ever kissed these lines; we just personally hope to avoid the catatonic state if at all possible.

One last technical anecdote to keep an eye upon as we consider the important asset class that are the precious metals. The bottom clip of the chart shows us yet another important technical indicator that is the monthly stochastics for gold. In very simple terms, gold has been in bull market flight when the monthly stochastics have remained above 50, as it is now, and vice versa. Even the meaningful 2008-09 correction saw a very short lived dip below this line as being the only violation so far n the secular bull cycle. This very simple technical indicator would have kept one "on the right side" of gold for two decades now.
Finally, as we step back and look at the fundamental landscape, it's very hard to imagine a world devoid of money printing ahead. We see currency debasement in the current cycle as being driven by two very important phenomena. Of course debasement is being used by central banks as a rhythmic offset to the really macro global deleveraging cycle playing out right before our eyes each and every day. Secondly, you'll remember that in the 1930's deleveraging cycle we witnessed countries across planet Earth erect trade barriers as a means of combating the deflationary effects of the global deleveraging cycle of that period. Our personal viewpoint is that the currency debasement of today is taking the place of the trade barriers of yesterday given the politically incorrect nature of trade barriers within the context of a current globalized economy where cooperation among not only governments, but importantly central banks, has become crucial. And so the global debasement activities are over for this cycle? Only if the deleveraging cycle is complete, which we all know it is not. Europe will have absolutely no choice except to overtly print money ahead. The only question is whether this occurs before or after a hard default. In stealth form the printing has already started. No printing means the European deleveraging cycle happens very quickly, but of course it would be accompanied by a deflationary fireball of historic proportion that would impact the entirety of the global economy quite negatively. And that is how likely to happen? The end of the global deleveraging cycle is so far from complete that in no way can it be currently "seen", and yet the end of the gold bull can? We beg to differ. Bull markets in any asset class "breathe" as they both inhale and exhale. It's all about rhythm. For now, gold is simply exhaling. Just remember, it ain't over 'til it's over.
Our very best wishes to you and your families for a healthy, happy and prosperous New Year.


