


2/1/2012 8:37:54 AM
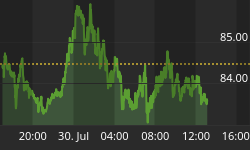
The top is forming but not yet complete...
Recommendation:
Take no action.
Click here to access our stock market chat rooms today! For a limited time, try our chat room for free. No subscription necessary to give it a try.
Stock Market Trends:

- ETF Positions indicated as Green are Long ETF positions and those indicated as Red are short positions.
- The State of the stock market is used to determine how you should trade. A trending market can ignore support and resistance levels and maintain its direction longer than most traders think it will.
- The BIAS is used to determine how aggressive or defensive you should be with an ETF position. If the BIAS is Bullish but the stock market is in a Trading state, you might enter a short trade to take advantage of a reversal off of resistance. The BIAS tells you to exit that ETF trade on "weaker" signals than you might otherwise trade on as the stock market is predisposed to move in the direction of BIAS.
- At Risk is generally neutral represented by "-". When it is "Bullish" or "Bearish" it warns of a potential change in the BIAS.
- The Moving Averages are noted as they are important signposts used by the Chartists community in determining the relative health of the markets.
Best ETFs to buy now (current positions):
Short DIA at $125.39 on Jan 30, 2012
Short QQQ at $59.88 on Jan 30, 2012
Short SPY at $130.51 on Jan 30, 2012
Click here to learn more about my services and for our ETF Trend Trading.
Value Portfolio:
We publish new reports to our free newsletter every month. If you're not a member, sign up by clicking here: Free Stock Market Newsletter
Daily Trading Action
The major indexes opened higher and dove for the mat through the morning like a prize fighter who had been paid to take a fall. The move lower slowed and there was a bounce in late morning that was eventually quashed and a new low found just before noon. The move lower had been well into negative territory but the bulls would tenaciously buy the rest of the session forcing a mixed close at about as close to neutral as they could get it. The late day bid for force the Dow and S&P-500 into positive territory failed but the NASDAQ-100 was able to close in the black notching a nearly eighth of one percent gain on the day. For the second day in a row, the Dow moved down intraday to touch and find support on its 20-Day Moving Average (DMA). As long as that support holds, the bulls will remain in charge. The semiconductor index (SOX 408.94 +0.20) was essentially unchanged. The Russell 2000 (IWM 79.02 -0.08) fell one tenth of one percent. The Dow Jones Transport Index (IYT 94.84 -0.08) also lost about one tenth of one percent. The Bank index (KBE 21.11 +0.00) was unchanged and the Regional Bank Index (KRE 25.81 +0.02) was essentially unchanged. KRE closed below its 20-DMA but KBE closed on its 200-DMA. The Finance Sector ETF (XLF 14.06 +.06) posted a gain of four tenths of one percent. All equity indexes have a BULLISH BIAS. All equity indexes we follow are currently in trading states with the exception of the Russell-2000 which is in a weak uptrend state. Long term bonds (TLT 120.85 +1.38) again added more than one percent and remains in an uptrend state with a NEUTRAL BIAS. Trading volume increased to near average on the NYSE with 894M shares traded. Trading volume increased on the NASDAQ to a bit below average with 1.740B shares traded.
There were four economic reports released:
- Employment Cost Index (Q4) rose +0.4% as expected
- Case-Shiller 20-City Index (Nov) fell -3.7% versus an expected -3.2%
- Chicago PMI (Jan) came in at 60.2 versus an expected 62.8
- Consumer Confidence (Jan) came in at 61.1 versus an expected 67.0
All first two reports came out an hour and a half hour before the open. The latter two trailed the open by fifteen and thirty minutes respectively.
Four out of ten economic sectors in the S&P-500 moved higher with Financials +0.4%, Utilities +0.4%, Telecom +0.2%, and Tech +0.2% posting gains. Consumer Discretionary -0.1%, Industrials -0.4%, and Energy -0.9% posted losses with the other three sectors unchanged.
The U.S. dollar rose two tenths of one percent and the Euro fell three tenths of one percent. The dollar had gapped down and rose through the session while the Euro did the opposite.
The yield for the 10-year note fell four basis points to close at 1.80. The price of the near term futures contract for a barrel of crude oil fell thirty cents to close at $98.48.
Implied volatility for the S&P-500 (VIX 19.44 +0.04) was essentially flat and the implied volatility for the NASDAQ-100 (VXN 19.89 +0.14) rose less than one percent.
Market internals were barely positive with advancers leading decliners 7:5 on the NYSE and by 9:8 on the NASDAQ. Up volume edged down volume on the NYSE and by a few percent on the NASDAQ. The index put/call ratio was unchanged closing at 1.31. The equity put/call ratio fell -0.07 to close at 0.61.
Conclusion/Commentary
Tuesday's trading was actually a loss by the bulls for the second day in a row but when the dust settled it seems the bulls and bears are somewhat evenly matched. The last days of a month and the first days of a month are generally bullish so the bulls have an updraft to ride for another couple of days. (This is primarily window dressing and putting new money to work by mutual funds). What will happen when this stops?
Wednesday marks the likely IPO for Facebook and the bulls are counting on this to rally the market. If we get a "sell the news" kind of day, then this will likely mark the end of the topping process. Speaking of which, tops are a process and bottoms are an event, at least most of the time in the stock market. If you looked at an ice cream cones profile, the top is generally rounded and the bottom "V shaped". That is how tops and bottoms often look in the stock market and we believe that the market is forming such a top now.
As evidence, we point to the longer term bond prices, which continue to move higher as investors seek safety. This flies in the face of the "risk trade" which is being conducted in the NASDAQ-100 and primarily in Tech. The other leading indexes aren't leading the way robustly higher with only the Semiconductor index finishing higher by a narrow margin.
Our only concern, at this time, is that we had a bad entry to our short trades (in particular for QQQ) and we may have to wait out a push higher before the bulls are exhausted. We are still looking to add our puts but only want to do so if we witness a climactic move higher. We have to respect the bulls here and their ability to rally the market still.
As we stated before, we believe that this week will be pivotal for equities with a top likely. We are still looking to add puts if/when DIA reaches the $129 level. We will keep you posted when the major indexes signal the top is in. We should point out that our decision to move to short positions was based on the probability of a top being put in this week as well as the desire to step aside from the potential of a wholesale sell-off getting underway. We must now be patient to see how the market reacts this week.
We hope you have enjoyed this edition of the McMillan portfolio. You may send comments to mark@stockbarometer.com.


