


CONTENTS:
PAGES
1. Gold Price influencing Markets: Summary.
1 - 4. Global Overview - affecting the Gold Price - as a Currency.
4 - 5. Current Market Fundamental Features - defining the Gold Price.
5. Key Gold Price relevant news of the week
5 - 6. Technical Analysis of the Gold Price Short / Medium / Long.
6 - 7. State of Regional Gold Market in their Currencies.
7. Silver
8. STOCK OF THE WEEK
9 - 13 Gold Shares - Technical Analysis
13 - 14. POLICY STATEMENT
That was the week that was - Gold Market action.
The Funds ruled the roost during the holidays and until now, trying to push the Euro gold price lower in the hope of triggering stop losses to drive the price even lower. Their moves have been in line with the performance of the $ and the Euro, as gold continues to reflect it role as a currency. The gold price has dropped down to $424, as a result. The market action was almost completely a result of Technical selling and fund liquidation alongside the usual "Arbitraging".
The start of the year, showed the main gold price drivers [short term [one week] having a weaker bias still. But underneath this surface picture, we see the funds may have shot their bolt having taken their holdings down to around 400 tonnes net long position, so are now vulnerable to a drive to buy gold, once the turnaround commences.
The Indian market is very much happier with prices at these levels and are coming in a buyers, but not acting in such a way as to chase prices up. We do expect volatility to be far higher this week, as the market tussles over direction, but look to be pretty close to consolidation time, prior to a recovery of the price.
The main feature triggering the fall, was as always, the $. It is seeing a recovery, that is bringing relief to many, for the Producers of gold from South Africa to Australia, giving a healthy feeling to the market. It's always so much more comfortable to buy after a good fall, isn't it? Nothing has changed below the surface. This wave may be going out, but the next will come in. The tide is still on its way in.
Gold Price influencing Markets - Summary Matrix| Market | Short-Term (weekly) | Mid-Term (1 - 6 Months) | Long-Term (6 months+) |
| Gold | Support: $420 Resist: $432 Action: Fall further | $500 assault | Four $ figures |
| Gold Stocks (HUI) | Support: 190-200 Resist: 210 - 212 Action: Fall further | Bullish | Very Bullish |
| U.S. Dollar | Support: 78 - 80 Resist: 84.7 - 85 Action: Rising | Slightly Bullish | Bearish |
| U.S. Treasury Bonds | Support: 104.20 Resist: 112.00 Action: Rising | Slightly Bullish | Bullish |
| U.S. Stock Market (DJIA) | Support: 10,415 - 10,600 Resist: 10,750 - 10,868 Action: Falling | Bearish | Bearish |
| Commodities (CRB) | Support: 275 - 276 Resist: 280 Action: Falling - Sideways | Bullish | Very Bullish |
Fundamental Overview Global picture affecting the Gold Price - as a Currency:
The state of the monetary world sets the climate for gold. As a Long term Thermometer, what happens to global confidence and ability of the major structures of the monetary world to measure true financial values, affects Gold. This overview will focus on the climate being set currently.
- The U.S. Dollar ($). The $ stage a rally which the market was extremely hungry for. No price just keep going down. It is time for a breather before heading down again. A further fall after the rally is what the U.S. Administration wants. Foreign Holders of the $, such as Japan are breathing much easier now. We believe that should it be necessary, countries in the same position as Japan, will intervene to lower their currencies against the $, so as to retain their export position. This does not include China, with its fixed rate against the $. Europe is the prime loser, but they have made it clear they will not interfere unless the falls are brutal.
- The present perception that the U.S. recovery is doing well, will work against a rising gold price in the markets, because it allows a recovery in the drooping confidence levels that lead to gold. It shouldn't, because strong economic growth increases the twin deficits, not lessen it. We expect the structural problems present in the U.S. economy will slowly bring a weakening of the U.S. economy. Later this year, a recessionary climate is possible. Normally this would have slowed imports, but as the effectiveness of Chinese imports is replacing U.S. Manufacturing, not simply competing with it, imports will continue at these higher levels leading to higher prices and inflation. The only weapon that the Fed can then use is to allow inflation to increase and follow this with higher interest rates. The interest rate pattern will not climb very much further as the U.S. economy is not resilient enough to absorb these. We are moving to a point where the Consumer spending patterns will be ruptured, with more increases. We believe that the Fed will continue to accelerate the printing presses of new money. To fail to do so will bring on a recession, a politically unacceptable alternative.
Please visit the end of the report to read the legal notice and disclaimer. All work is copyrighted and may not be distributed without written permission. © 2005
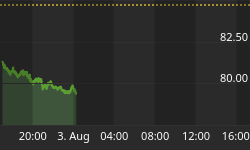
 The U.S. $ Index
Technical Chart Commentary:
The U.S. Dollar continued its steep decline in an aggressive trending channel, lower. After breaking the pivotal 84.70-85 support, the index has hit its next support level. From many years of data, this is seen just around the 80 level, a significant level of support. Only once, in decades of data has the index fallen below 80 and that was briefly to 78. In this area, support will be found and from here the dollar can create a short-term bottom. A relief rally is being seen and but will have great difficulty in moving above the 84.70-85 resistance. The Dollar Index has started off 2005 moving from oversold conditions and testing the downtrend channel resistance.
Fundamental Features:
The main short term feature still is, the relationship of the U.S.$ to the Euro. The ¼% rise in the Fed Funds rate was not as high as had been expected. The "neutral level" which is supposed to be the target level the Fed wants rate to rise to is 4%. This is translated to mean the level at which inflation stands. So at 2.25% the level is well below that. We believe they are unlikely to be reached. In 2005, we may well begin to see an easing of rates, towards the end of the year, unless inflation accelerates, taking interest rates with it. This is unlikely. Why? Because growth has not proved to be as vigorous as had been hoped and expected. This should exacerbate the weakness of the $ through 2005 and onwards, benefiting gold.
We see a strong deflationary influence coming from a poor jobs picture, restraining any inflationary tendency in the economy. Add to this the taxation like effects of higher oil prices, which although they have dropped lately, should resume their rises shortly. All this attacks the spending power of the average U.S. consumer, now over leveraged, the main driving force behind the U.S. economic recovery. Inflationary forces are at work within the States, pushing up prices in the sectors gaining from the recovery. The twin pressures of deflation and inflation join to take the wind out of each others sails. The figure resulting from this addition looks tame, but belies the real picture. The two are often set off against each other, but this is a false equation, with the two acting separately from each other, separately pernicious to the health of the U.S.
The "Twin Deficits"
 [See the chart to the left] The measurement of the state of the American economy is often checked by the levels of the S & P 500 and the Dow Jones Industrial Index. This is not a good measure when we translate this through to gold. Gold does not move inversely to the Dow or S & P. A far more intimate relationship for gold is the one it has wit the "Twin Deficits". A slowdown will lessen the Trade deficit, and lower the Dow and S & P, whilst an increase in growth, will increase the Dow and S & P and raise the Trade deficit. However, if the tendency is to move towards a recession, the loss of confidence will lower Investor confidence in the Dow and S & P, and encourage these Investors to turn to gold. So gold gains both ways! The instability either of these creates, is favourable Medium to long term to the Gold price.
Alan Greenspan, Chairman of the Federal Reserve, highlighted the dangerous levels of the "Twin deficits". The U.S. Trade deficit is running at around 6% of Gross Domestic Product. What are these two deficits? They are the government deficit, wherein it is spending more than it pulls in, in tax and other revenues, the second being the Trade deficit, the spending of U.S. $ overseas on imports, less the amount earned on exports. At a record level of over $55 billion, last month, but expected to fall in line with the decline in the oil price, these levels are an abrasive influence on the confidence in the $! This is now a short, medium and long term positive influence on the $ gold price.
Global Ramifications
The developed world has as its hub, first the U.S.A. then Europe. Oil payments are a transfer of wealth to the Oil Producers. Likewise all nations that import goods from the Far East see a transfer of their wealth to the East. The U.S. and Europe, plus the rest of the world, import both oil and Far eastern goods. In turn Oil Producers and the East, take this money [their surplus] and re-invest it in the U.S., through the Capital account and invested in the U.S. Treasury market. This process places control over these imported $s in the hands of foreign nations, a feature that implies a long term support for the gold price, but on top of its threatening nature, could precipitate a massive demand for gold, eventually.
 Return on Investments?
Technical Commentary:
It is with amazement to many in the investment community, as well as financial and economic observers, as to the current strength of the 10-year treasury market in 2004. The longer-term trend is showing lower prices as we currently push the upper resistance of the channel. It appears the path is lower as we being 2005, with rising rates supportive for the US Dollar.
Fundamental Features
The slow down in rate increases and our expectation of an easing of these rates will see this market continue to see yields decline and prices rise.
U.S. Treasury stocks are where foreign $ Investors look for a return on their investments. But that is not the sole purpose of the investment. Such liquid assets are purchased primarily because they are easily liquidated and spent on paying for development of the surplus nations. For instance, China is not buying U.S. goods for the development of their infrastructure, but buy from other Asian nations, building a dependency of those nations on the new Chinese financial empire. They pay for their developments with these surplus $ and Treasury investments, occasionally experiencing a Trade deficit themselves. The difference between them and the U.S. is that they have ended up with massive growth, nearly always over 10% per annum, through the last decade, a trend that is set to continue for more than the next decade. We have stated before that the Chinese economy is set to overtake the U.S. in $ terms, but if you equalise the growth in real terms, not cost terms, China is currently 60% the size of the U.S. already. Now add to that that the U.S. has around 260 million citizens, against the 1.3 billion citizens. Unless stopped, China is set to be the largest economy in the world in a few short years and then to keep growing to dominate the global economy. The persistent news that China is securing holdings in key resource producing companies demonstrates the race for permanent access to resources. The news that China may get 20% of Yukos, the Russian oil Producer, is the latest. The new weapons of empire building are dollars and equity holdings, a lesson taught to the Chinese and Russia over the last 30 years. Their practice of this line of action will lead to some form of confrontation, well before they have drawn these resources away from Western control. Capital and Investment control may well only start the process. With China willing to invest in resource supplying countries of an unstable nature on terms that the West will not, the developed world is already on the back foot.
It is highly unlikely that the developed world will sit idly by while they lose both power and wealth to an East that is not under their control, as is Japan, Korea, Taiwan and the Philippines. Any retaliatory or preventative action to stop this will begin to emerge from 2005 onwards. This raises the level of instability and the gold price IN ALL CURRENCIES!
Current Market Fundamental Features Defining the Gold Price.
Stemming from the "climate" created by the global macro-economic view, springs reaction from the more direct influences on gold. This section will cover the Technical Analysis of the Gold Price and bring perspective to the events that define these reactions.
Summary
-
Physical demand will recommence buying, once the gold price stabilises at lower levels, as the wedding season is still under way in India and the fall in prices removes the thought that one is "buying at the top".
-
De-Hedging continues unabated.
-
"Official" gold holders have swung towards retaining gold rather than selling it. Argentina has even begun buying it!
-
With the advent of being able to buy gold 'paper' [each share representing 1/10th of an ounce of gold], a new source of demand for gold has come to life. Capable of rising from the holding of just below 100 tonnes, it has the capacity to grow to 500 tonnes, just to equal the equivalent level of the U.K. equivalent's present holdings. 2005 should see a steady rise in this demand.
-
The sum total of the medium to long term fundamental factors remains positive.
-
Strong Producer country currencies, are sapping the income gold producers are receiving for their gold, shortening mines lives and gently lowering the amount of new gold they are Producing.
The London Gold Fix
6th January a.m. $425.80 €322.869
5th January p.m. $426.00 €320.555
Current London Fix: Latest London Fix
Latest
At the time of writing, gold stood at $424.75 and in Euros 321.659. The Euro is worth $1.3205.
Key news items this week, affecting the Gold Price:
Why Chinese demand is still relatively untapped. - Long term influence!
-
Chinese demand is expected to rise from 200 tonnes to 600 tonnes, within a couple of years. The demand is brisk, furious and all consuming. The Chinese hold more than one trillion Yuan in simple bank deposits. If there is to be a revaluation of the Yuan, you can expect a massive increase in immediate demand for gold as the Yuan will then buy much more gold at its higher value from the well-informed section of the Chinese public.
-
Chinese demand has been only a trickle. The average, uninformed Chinese citizen likes gold for traditional reasons and has always done so, even conducting property transactions with gold. No, the main problem is one of distribution capability. Once gold bullion is easily available countrywide, demand will be countrywide! As distribution is established so demand will increase. Within two years we expect Chinese demand to be far greater than at present.
The Rand and the Royalty tax - why so destructive in S.A. and not in Chile
Medium to Long term Influence!
Chile has announced a Royalty Tax of 5% on profits of the mines. Whilst this does increase the costs a mine must suffer before it makes profits, this is not onerous.
In South Africa the Royalty Tax will be 3% Royalty Tax ON TURNOVER.
-
This will have no effect on Mining Investments in Chile.
-
In South Africa, such persistent aims of the taxation authorities will discourage future investment in new mines. It has a variable impact on profits and could increase losses!
The Technical Picture of the Gold Price:
The Gold Bullion Price expressed below is the price defining those of the Futures / Options / and Exchange Traded Funds, representing a portion of an ounce of gold. The $ price of gold is the one all market operators relate to, due to the $'s position as the present global Reserve Currency. All eyes remain firmly fixed on this price, even though Operators in Canada / Australia / South Africa / India as well as all other exchanges have to operate through their own currencies.
Gold Long-Term: 5-Year Weekly [Current Gold Price & Chart]
 Technical Commentary:
The weekly chart shows the bull market channel remaining firmly intact. Recent price jumps close to $460 found resistance again, at the top of the channel. We are now finding consolidation conditions just under prior highs, with supportive price action found from the continuing decline in the U.S. Dollar.
The long-term gold market bull now finds good support initially just above $430 with the long-term uptrend support now entering the $390's. After decling from prior highs, positive momentum is succumbing now to profit taking and will find difficulty jumping above prior highs, unless a new long-term channel is to be estabilished.
State of Key Regional Gold Markets in their Currencies:
London

 London dominates the physical market in gold. The Comex market exercises a primarily short term surface action for gold, London see the buyers and sellers who prefer the low profile, acting in such a way as to be relatively inconspicuous. Rarely do they make the 'waves' in the market, but they do set the Tide and the currents deciding the gold price. The fix is where the large majority of deals are made in London. We expect in 2005 the Fix will exercise even greater dominance over the daily prices. Whilst the $ is still the prime currency in which the gold price is made, its relationship with the Euro is the one that has defined it most as a currency, over the last year. The gold market keeps a very close eye on the Euro price, with dealers 'arbitraging' between New York and London constantly to ensure the prices are not different. Presently the Euro price is the definitive price of gold, against which other prices are measured.
Technical Commentary: [Euro Gold Price]
The support fell out of the Euro gold price last week and the large drop is underway. The next major support is just euros away, just around the 317 level. I would expect this level to hold. If this correction fails to find support here, look for 300 Euros. For now, the Euro gold price appears to be channelling from the 315-350 range.
Technical Commentary: [US Dollar Gold Price] [Chart on above page - right] 2005 started off with a bang. With Canada, UK, Japan markets closed, the first trading day in the US saw limit stop orders triggering a quick slide for gold. After failing to stop at $432-433, gold slid quickly to the mid $420's before reversing slightly.
Action: With two major short-term supports violated, gold now is likely to fall even further. Unless the U.S. Dollar fails to stabilize and firm around these levels, gold is looking like it seeks to move lower towards the next major supports, the low $420's. The next uptrend support is just dollars away for the $420 level with minor support in the mid $420's. Oversold conditions are approaching and could indicate a bounce latter this week with $432-433 as now the first significant resistance.
Euro: (Euro €: $1.3205)
The Euro hit tremendous strength, before slumping back to 318, before recovering to the present 321.62. Gold in the Euro has fallen as well. At first gold fell in both currencies at the same pace. Then as the $ continued to strengthen, gold steadied, while the Euro fell further, showing just how the funds are successfully managing the market. Primarily a Technical play this has to be seen as good value returning to the gold price. Over the years, gold has established a standard Euro price of 330. With the fundamentals so strong over the medium to longer term, we have no doubt that this is indeed, an opportunity!
We are of the belief that the volatility of the markets has increased tremendously. If this volatility is here to stay, then many forecasters are going to be driven to the back foot, as consolidations and rallies prove speedier than expected. In the 1970's the time frame for the rising market was relatively slow, because technologically the market was far closer to the stone age than it is now. This has to translate into the speed of market reaction that can now happen in a heartbeat.
India - The Rupee & South Africa - The Rand

 India: With India responsible for 20% to 25% of the buying of newly mined physical gold supplies, it is the most important regional gold market in the world. Despite its professional approach, India does make waves in the market, albeit of the strong but gentle nature. The Rupee is the price the Indian buyers pay for their gold, so if strong, their gold price drops, if weak, their gold price rises.
Rupees: ($1: Rupees 43.85)
Present Price [excluding duties, etc] Rs.18,625.29 [last week: before the recovery, Rs.19,363.77]
Technical Commentary:
The Rupee gold price (above) find support just below, the 19000 level with the next support in the low 18,000's.
Key Fundamentals for the Indian Market.
The pullback on the gold price alongside the stronger Rupee, is welcomed by the Indian buyers, now comfortable with these prices. Still in their Wedding season, but with Diwali behind them, demand may be good, but not a vigorous as before. The demand from this market for the third quarter was poor compared to the first half, but the fourth quarter should see a healthy recovery in demand from the largest new gold buyer in the world.
South Africa: The South African Rand is the price paid to the Gold Mines. With South Africa producing 11% of the world's new gold, and some leading Mines operating there, the balance of future gold supplies is directly affected by the strength or weakness of the Rand, so the Gold Price in Rands is a key one to the gold market.
South African Rand ($1: R6.0825)
The Rand gold price (left) has been consolidating around the very supportive 2,400 - 2,500 level. A strong downtrend line is creating a converging triangle, which is likely to lead to an upside breakout sometime latter in 2005.
For now, the Rand gold price remains under pressure from the weaker gold $ price market, along with the strong Rand.
Key Fundamentals for the South African Market
And the Rand went stronger again, by another 13 cents, before recovering a full 25 cents against the U.S $, with the latest $ rally! This is solely because of the $ action with zero input from the South African Authorities, who remain oblivious to the plight of the exporter and the opening of the country up to floods of imports, destroying home grown industries, in the process. Probably hoping that the steady rise in U.S. rates will discourage Rand investors as the interest arbitrage number narrow, the Reserve Bank focuses on the dropping internal inflation and the booming economy. With the impact of the BEE [Black Empowerment] broadening the base of the economy, many in South Africa believe all is very well, but can they afford to savage the industries the economy has depended on for so long The future looks bleak because of such myopia. A renewal of the fall in the $ will strengthen the Rand still further, eventually, after this present rally.
Three weeks ago the gold price per ounce was R2,628.22, today it is R2,583.54.
The Rand is at R5. 87 to the U.S. $, after hitting R5.62. At R6.00 to the $, its level was manageable by the S.A. Mines. The mines have work 24/7 for some months so far, to minimise extraction costs. It is not enough. It is shortening the mines lives, causing job losses and promising to constantly decrease the amount of new gold reaching the markets from that country.
Mines like Harmony and Durban Deep achieve a substantial proportion of their income from non-South African mines in their stables so should be seen as international mines, not purely South African ones.
Silver $6.425 [Euros 4.866] [ Current "Silver Price"]
 A beautiful yet brutal market for traders, silver underwent a fierce correction in early December sending the metal down nearly $2/ounce, with most of the losses occurring in just a few days time! In the last few more days, after the holidays, Silver continued to fall to the lower half of the $6, at $6.43
Support held well though at the upward trend support established back in early May only to succumb to new selling pressures created by the gold sell-off at the start of 2005. Resistance is now seen around $7, with a pullback to support at the low $6 now expected.
Action: These appear to be attractive levels to cover shorts and establish long positions.
We have now achieved $1.32 profit on our 'short' position. Our Subscribers are very happy. Wouldn't you like to be in line for these potential benefits. We are finalising the format of our new services right now and will be letting any who wish have a sample of these, prior to being asked to subscribe to them. Please contact us for these samples, if you haven't already received one?
The pattern of far greater volatility than gold seems set to be the pattern for the short and possibly the medium term for Silver. But please note that this has and could well be that it rises equally dramatically!
Stock of the Week
Golden Phoenix Minerals
OTCBB: GPXM
Support: .15 & .19
Resistance: .24/.25
Action: Buy on weakness around and under $0.20, sell just under $0.24-25 short-term. Long-term, stock has potential to surge to and exceed prior $.50+ highs. If Ashdown is a success, this stock could easily be $1+.
 It was absolutely a wild week for the Nevada-based junior gold producer. With large volume selling hitting the stock early on the week, new lows were forged as a low of $0.15 was achieved on Tuesday.
A reversal hit the stock Wednesday as bargain hunters propped up the price nearly to .20 before the news release latter that evening (more below). The stock surged Thursday on the news, on heavy volume, with some trades pushing the stock as high as $0.24 early on! Then profit taking and a large seller(s) at the close took the stock down right back to $0.17. Apparently the drastic selling at the close was more of a fluke and bidding of the stock on Friday pushed it to settle the wild week at $0.22, nearly 50% higher than the low Tuesday!
The price reversal looks bullish and if a close above the trending channel lower occurs next week, it could signal prices moving back to the mid $0.20's. The resistance right now is set at .24-.25 with support just below around $0.20.
 Lengthy criticism from shareholders including the underperformance from the gold/copper Mineral Ridge property, were some of the major issues confronting management and specifically company founder, Mr. Fitzsimonds.
This led to a drastic decision right before the year's end with the departure of Fitzsimonds as CEO and Chairman of the Board. Included in the management restructuring plan is a less detailed outline regarding their current production/exploration plans. It appears they are going to be focusing their attention on the moly-gold project, Ashdown and mothballing their other projects.
With moly prices surging from $8 pound a year ago to now just fifty cents from $35, this extremely high grade moly deposit is just about to undergo a test pilot program before commencing production.
As good as this project sounds, Golden Phoenix must perform if they wish to retain their lucrative option (60%) on this property, based in Northern Nevada. Unfortunately, if they fail at profitable production of the Ashdown project, which projects hefty positive cash flow even at the low-end 100/tons per day milling rates, the company faces dire financial straights.
It is do or die time for the company. It is obvious their mining abilities have not met the level of anticipation in 2004 and thus the stock has fallen to the $0.20 area as disgusted shareholders continued to sell including some of the largest investors.
The company made a good initial move last week by concentrating their attention on bringing the Ashdwon project online. Even if the price of Moly crashes 50%, the mine is a cash cow, which enables them to grow production and exploration elsewhere as well.
The management shake-up was well received by stockholders I have been in communiqué with including myself. Many have advocated management change, and it was apparent the pressures finally resonated with the board.
Their approach on focusing exclusively on the Ashdown project is also a wonderful move. Mineral Ridge has been plagued with production woes and the copper exploration results are dismal. I do hope they are going to be 100% focused on the moly project, with profitable moly production leading to a larger mill capable of handling the gold deposit as well. Success with GPXM must be met with results at this time and until this is met, the company may be met with pressures from the investment public, unless a return of speculative mania returns to the junior sector.
Technical Charts:
(AMEX: HUI Index): 6-months Daily Support: ~200, 190 Resistance: 210-212, 220-222 Comments: Oversold conditions being established with strong selling momentum in command. Quick reversals are likely to meet selling and short-lived, unless a drastic reversal in gold occurs. |
(AMEX: HUI Index): 3-year Weekly ["HUI Components" ] ["HUI QUOTE"] Support: 190's Resistance: 210-212, 220-222, 240-250 Comments: Entering oversold conditions and weekly MACD still heading south. This indicates we are going to see a retest of the long-term uptrend support, which is entering the low 190's. |
(NYSE: NEM): 1-Year Daily Support: Support has fallen and now is likely to move back towards the very strong $40 level, where a long-term uptrend exists as well as other support zones. Resistance: On the chart where the black arrow indicated a gap lower, will provide as resistance with minor resistance around $42.50. Comments: Volume is very large on this sell-off and is more likely than not to move to just above the $40 support. Provided as to what gold and other equities do, NEM is likely to find very good support around this level. Buy on this dip looks very attractive, does not appear there is a need to rush in, being patient and waiting for a bit more selling appears to be the prudent move at this time. |
(NYSE: MDG): 1-Year Daily Support: The first support is in play now just aroudn the $17 mark. The next major one comes in just above $15. Resistance: Minor aroudn $18 then $19. Comments: Volume is very large on this sell-off like Newmont's, I would be catious here. If the current support falls, it appears a fall back to $15 is likely, where an uptrend support and strong support intersect. Entering oversold conditions, a minor reversal is possible, but likely to be short-lived unless a dramatic reversal in the HUI/gold occur. The sellers have the upper hand and this could take a few weeks to resolve itself. The risk is to the downside and it is safer to let the market resolve the ultimate bottom. |
(AMEX: GSS): 6-months Daily Support: Very good support at the $3.50 level. Resistance: $4.25 then again at $4.50 Comments: This drop back to $3.50 looks to be very attractive as this stock is now trading nearly $5 from late 2003 highs. If $3.40-3.50 falls, this stock could se emore punishment all the way back to the low $3's. I would rate this high beta, growth gold stock a strong accujmulate on pullbacks. Fundamentally and technically, the stock is very close or at its bottom. After last quarter's dismal performance and the subsequent liquidation by its largest fund holder led to a large amount of oversupply of shares hitting the market. It appears a good amount of accumulation is occuring and over the next several weeks, there should be a lift off these lows in a better gold environment. Next qurater's numbers out in a few weeks should also be closely watched as new production should begin positively impacting the bottom line along with redcution in production costs. |
(AMEX: NG): 6-months Daily Support: $7 then $6.8. Resistance: $7.80 then $8. Comments: This stock has undergone great accumulation late last year from $4 to the mid-$8's. It is holding up well on the current consolidation and should find good support aroudn the $6.80 area. Any quick share pullbacks are good quick trades and pullbacks should be viewed as great buying opportunities for long-term holdings. The company does appear to have a bit more weakenss to deal with along with the general metal stocks, but should hold up well compared to its peers. |
(NYSE: AEM): 1-Year Daily Support: $13 then $12 Resistance: $14.10-14.25 Comments: Long-term uptrend support (not shown) hits the $13 support. If $13 holds, this would be a good trade as a rise back up to the low $14's, a gap fill, will occur. Question is if $13 will hold? If not, $12 will be a very good support level, which may occur with possible more weaknaess in the metal euqity sector. I would be cautious at these levels until deeper oversold conditons are placed. |
(NASD: GOLD): 1-Year Daily Support: $10.25-10.30 Resistance: $11.20 then 11.50 Comments: Stock has pulled back to a big support as the stock enters oversold conditions. Stock appears capable of dropping to the 200 DMA, $9.80 support or even lower to the $9.20 support before reversing. If the drop is to occuring on the next week, this could be a good time to play a quick bounce. |
Vista Gold Corp. (AMEX: VGZ): 6-months Daily Support: ~$3.40-$3.50's Resistance: $3.75, $4 Comments: Vista Gold broke its $3.75 support and dropped quickly towards the $3.50 level. In this area, this junior should find a bottom, with a risk down to the $3.25 area possible, if more weakness is to be had. A gap just above $4 should provide resistance on any move higher with a break of this indicating a move to $4.25-4.50+. This appears to be a very attractive area to establish a position. |
Geocom Resources Inc. (OTCBB: GOCM): 1-Year Weekly Support: $0.30-0.33 Resistance: $0.45, 0.75 Comments: Illiquid junior providing a great profitable trade if you time this right. It is at a current support level with a channeling trend lower. Buy any spikes lower, sell any spikes higher - which typically occurs on the day news is released. Longer-term this should be a great area to accumulate from those frustrated sellers. |
 Gold Bugs Index: Short-Term
 Gold Bugs Index: Long-Term
  Newmont Mining Corp.
  Meridian Gold, Inc.
 Golden Star Resources
 NovaGold Resources Inc.
 Agnico Eagle Mines Ltd.
 Randgold Resources Ltd.

Next Issue: More juniors/exploration stocks: AGT, CRCUF, MMRSF, CUSIF and CGREF.
Policy Statement.
In "Global Watch - The Golf Forecaster", we will present the global picture, as it relates to gold and its price whilst synthesising these factors to forecast the gold price.
The gold price is an amalgam of diverse and changing influences, from Currencies to Jewellery, from Investors to Speculators. From Asia, to India, to Australia, to Canada, to South Africa, to the U.S.A. and to Asia, the gold price is of interest to all. It cannot be seen in isolation as a metal, but must be understood as a Global Thermometer measuring monetary, political, economic, stability as well as the raw demand / supply features of the metal itself. These factors do not merely add up to the price but interact in sometimes strange ways, to produce the gold price. For example, rising prices often lead consequently to rising demand, as the appetite for the metal grows. Its price may rise in one currency and fall in another, at the same time. Overall, it reacts sensitively to the overall level of global stability, which, in turn, gives us the gold price.
It is our task in this letter to track these different features, giving you both the Technical Analysis and the fundamental features impacting on the gold price each week. It is our goal to help you to understand and profit from this market, wherever you are on this globe, in a professional manner. We welcome any input or observations you may have, which contribute to the enhancement of this service.

To Subscribe to "Global Watch - The Gold Forecaster", please go to: www.goldforecaster.com
To Subscribe to "Gold - Authentic Money" or "Gold - The Weekly Global Perspective", go to this link: - www.authenticmoney.com


