• 553 days Will The ECB Continue To Hike Rates?
  • 553 days Forbes: Aramco Remains Largest Company In The Middle East
  • 555 days Caltech Scientists Succesfully Beam Back Solar Power From Space
  • 954 days Could Crypto Overtake Traditional Investment?
  • 959 days Americans Still Quitting Jobs At Record Pace
  • 961 days FinTech Startups Tapping VC Money for ‘Immigrant Banking’
  • 964 days Is The Dollar Too Strong?
  • 965 days Big Tech Disappoints Investors on Earnings Calls
  • 965 days Fear And Celebration On Twitter as Musk Takes The Reins
  • 967 days China Is Quietly Trying To Distance Itself From Russia
  • 967 days Tech and Internet Giants’ Earnings In Focus After Netflix’s Stinker
  • 971 days Crypto Investors Won Big In 2021
  • 972 days The ‘Metaverse’ Economy Could be Worth $13 Trillion By 2030
  • 972 days Food Prices Are Skyrocketing As Putin’s War Persists
  • 975 days Pentagon Resignations Illustrate Our ‘Commercial’ Defense Dilemma
  • 975 days US Banks Shrug off Nearly $15 Billion In Russian Write-Offs
  • 978 days Cannabis Stocks in Holding Pattern Despite Positive Momentum
  • 979 days Is Musk A Bastion Of Free Speech Or Will His Absolutist Stance Backfire?
  • 979 days Two ETFs That Could Hedge Against Extreme Market Volatility
  • 981 days Are NFTs About To Take Over Gaming?
  1. Home
  2. Markets
  3. Other

The State of the Trend

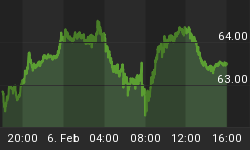
Last week we observed that the daily, weekly and monthly trends for the three major US indices were pointing upwards, and all of them were bumping against long-term resistance. After Friday's employment report, the trend in all timeframes remains unchanged, but the Q's are the only ones that were able to break above resistance. Judging by the monthly chart below, they have another 5% upside potential before reaching the next resistance level at around 65. In the meantime, 60 becomes an important resistance turned support level to watch:

As mentioned before, the resistance zone for the DJIA remains in the 12800-12900 area:

While the SPX has the most ground to cover in order to break above the 1370 level:

Following the relentless advance since December '11, and the opening gap on Friday, the weekly SPX has finally decoupled from the trend indicator and is approaching overbought levels historically associated trend changes. For next week, the overbought zone comes in above 1370, with the trend indicator currently at 1318.


The new OddsTrader Trend app gives users acces to these levels for every stock, index or mutual fund, along with some other useful information. Check it out.


Back to homepage

Leave a comment

Leave a comment