


2/27/2012 10:14:29 AM
Things start looking a little scary.
Sorry for the delay this morning, there's so much going on and sometimes I get lost in the data, news and interviews that occur over the weekend. I also wanted to remind people regarding the price increase - this won't impact you - you have locked in your subscription price for as long as you remain subscribed. You can email me at jay@stockbarometer.com if you have any questions.
I think the best interviews was with Lakshman Achuthan from the ECRI, as he was on both CNBC and Bloomberg updating his recession call. If you remember, he came out last september and called a recession to hit around Q2 this year. Now if you think market timing is tough, try economic timing. It makes for great debates, but I've never put any weight into economic reports, because the timing is dismal for trading in the short term.
That being said, here's a chart that he referenced quite a bit:

Well, if you look at the data on the very right (and this is data, or facts as both I and Lakshman like to say - and not forecasts) it's never been this low (in 50 years) and not resulted in a recession...
Here's his ECRI Growth chart, with one caveat, no past adjustments to data (I NEVER adjust old data, because if you do, you're changing facts in hindsight and thus, it's not a fact if it can be changed...It's just a pet peeve of mine):

The other issue with calling recessions is that you may be in one, but not know for several months as data gets adjusted. I'll have more on this in my research blog as I have more time to accumulate my notes.
If you're not a member of our free weekly mailing list, feel free to sign up by clicking here.
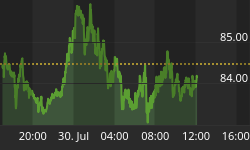
Here's a look at the global markets:

On the economic front, here is the schedule for this week. Pay close attention to the timing of the report and the potential for the markets to make short term reversals at those points.

On to the charts:

Stock Barometer Analysis
The barometer remains in Sell Mode and we're looking for a 1-2 week correction into 3/16. Note, 3/10 is a 9 month cycle low.
That being said, be very cautious of a short term sell off and a continuation of this rally into March. It's very strong - and note the inversion of our 2012 forecast looking at a 3/16 top. What happens with bearishness is that it can be so strong, so fast, that it actually produces bullish energy for the markets to rally. This is why Mark McMillan calls tops a process as opposed to bottoms, which are events.
The Stock Barometer is my proprietary market timing system. The direction, slope and level of the Stock Barometer determine our outlook. For example, if the barometer line is moving down, we are in Sell Mode. A Buy or Sell Signal is triggered when the indicator clearly changes direction. Trend and support can override the barometer signals.
Money Management & Stops
To trade this system, there are a few things you need to know and address to control your risk:
• This system targets intermediate term moves, of which even in the best years, there are usually only up to 7 profitable intermediate term moves. The rest of the year will be consolidating moves where this system will experience small losses and gains that offset each other.
• This system will usually result in losing trades more than 50% of the time, even in our best years. The key is being positioned properly for longer term moves when they come.
• Therefore it is vitally important that you apply some form of money management to protect your capital.
• Trading a leveraged index fund will result in more risk, since you cannot set stops and you cannot get out intraday.
Accordingly;
• Make sure you set your stops so that you can lose no more than 2% per trade (based on the QQQQ if you're trading leveraged funds and options with our trading service).
Potential Cycle Reversal Dates
2012 Potential Reversal Dates: 1/12, 1/27, 2/16, 2/23, 3/16. These dates have an accuracy of +/- 2 days. We publish dates up to 2 months in advance.
If 2/23 gets confirmed as a top, we see a move lower into 3/16. That would actually be in line with a 9 month cycle low date. This is a year with 2 9-month cycle lows. If the first one has no impact, the second one should have more. Much more...
Subscribers to our IRG Market Timing and Sentiment data service can see the performance of these forecast turn dates going back to 2005 and for the remainder of 2012.
My Additional timing work is based on numerous cycles and has resulted in the above potential reversal dates. These are not to be confused with the barometer signals or cycle times. However, due to their past accuracy I post the dates here.
2011 Potential Reversal Dates: 1/15, 1/29, 2/16, 3/10, 3/18, 4/6, 5/21, 5/31, 6/13, 6/24, 7/16, 8/1, 8/19, 9/4, 9/25, 10/21, 10/25, 11/25, 12/26.2010 Potential Reversal Dates: 1/19, 1/28, 3/2, 3/23, 4/7, 5/30, 6/10, 6/28, 7/10, 8/13, 9/7, 10/2, 10/27, 11/21, 12/19. 2009 Published Reversal Dates: 1/20, 2/11, 3/7, 3/15, 4/8, 4/16, 4/27, 5/7, 6/8, 7/2, 7/17, 9/14, 10/10, 10/24, 11/12, 11/30, 12/9, 12/21, 12/29. 2008 Potential Reversal Dates: 12/31, 1/11, 2/1, 2/13, 3/6, 4/5, 4/22, 5/23, 6/6, 6/27, 7/13, 9/2, 10/3, 10/22, 11/10, 12/11. 2007 Potential Reversal Dates: 1/10, 1/14, 1/27, 1/31, 2/3, 2/17, 3/10, 3/24, 4/21, 5/6, 6/15, 8/29, 10/19, 11/29, 12/13, 12/23, 12/31, 1/11/08. 2006 potential reversal dates: 1/16, 1/30, 2/25, 3/19, 4/8, 5/8, 5/19, 6/6(20), 7/24, 8/20, 8/29, 9/15, 10/11, 11/28. 2005 Potential reversal dates: 12/27, 1/25, 2/16, 3/4, 3/14, 3/29, 4/5, 4/19, 5/2, 6/3, 6/10, 7/13, 7/28, 8/12, 8/30-31, 9/22, 10/4, 11/15, 11/20, 12/16.
Timing Indicators
Use the following Timing/momentum indicators to assist in your trading of the QQQQ, GLD, USD, USO and TLT. They are tuned to deliver signals in line with the Stock Barometer and we use them only in determining our overall outlook for the market and for pinpointing market reversals. The level, direction, and position to the zero line are keys in these indicators. For example, direction determines mode and a buy signal 'above zero' is more bullish than a buy signal 'below zero'.
QQQQ Timing Indicator (NASDAQ:QQQQ)
The QQQQ Spread Indicator will yield its own buy and sell signals that may be different from the Stock Barometer. It's meant to give us an idea of the next turn in the market.
Gold Timing Indicator (AMEX:GLD)
Want to trade Gold? Use our signals with the Gold ETF AMEX:GLD. Gold gives us a general gage to the overall health of the US Economy and the markets.
US Dollar Index Timing Indicator (INDEX:DXY
Want to trade the US Dollar? Use our signals with the Power Shares AMEX:UUP: US Dollar Index Bullish Fund and AMEX:UDN: US Dollar Index Bearish Fund.
Bonds Timing Indicator (AMEX:TLT)
Want to trade Bonds? Use our signals with Lehman?s 20 year ETF AMEX:TLT. The direction of bonds has an impact on the stock market. Normally, as bonds go down, stocks will go up and as bonds go up, stocks will go down.
OIL Timing Indicator (AMEX:USO)
Want to trade OIL? Use our signals with AMEX:USO, the OIL ETF. We look at the price of oil as its level and direction has an impact on the stock market.
Secondary Stock Market Timing Indicator

We daily monitor hundreds of popular and proprietary technical indicators that break down market internals, sentiment and money flow to give us unique insight into the market. We feature at least one here each day in support of our current outlook.
As a subscriber to the Daily Stock Barometer System at the $50 level, you also get access to all our charts and research. Email Carl@stockbarometer.com to upgrade your subscription.
Daily Stock Market Outlook
We remain in sell mode, looking for the markets to move lower into 3/16.
The above chart shows our qqq spy rsi spread chart, which if we start moving lower, we'll use to help identify a bottom. It needs to get below zero for more negativity to get into the market.
Here's our current positioning.
- Last Recommendation - 1/24 - Sell Signal/Short qqq
- Status - Stopped Out
- Consideration - Reenter short position on qqq close below 9dma
Retirement Advisory
2/3 Long Exposure. Move to 1/3 on a SPY close below 135.5. Move to cash on a SPY close below 133.17. We remain on a longer term put cash to work signal from September, 2010. However, we're beginning to see the potential for weakness. We do not have a potential crash signal at this time.
Subscribers to our Market Timing and Sentiment data service can access our bond stock rebalance model, long term cash buy signals and crash alerts on the NYSE and NASDAQ updated weekly.
As we consolidate the Retirement Plus 1-2-3 Service into the Daily Stock Barometer, look here for advice on long term signals to put cash to work, bond/stock reallocation signals and cautionary crash warnings on the stock market.
If you want to learn more about some of my models and indicators, I use my blog to cover them in more detail. If you're looking for more information, please visit our blog - I'll have updates and publish other articles there. http://investmentresearchgroup.com/Blog/
Regards,


