


Here's what we see.
Technically the barometer went into buy mode on Tuesday. However, with the market advancing so sharply in the am, a divergence in some key technical, the LTRO on Wednesday and Apple's court case in China going on, I didn't feel compelled positioning long with the potential of a strong reversal.
Technically, the last two days as the market went up, the number of new highs contracted. And on the first up day, the number of new lows grew. In addition, breadth was negative on both of the last two days. This is not a bullish development.
Then the signal from oil, which pulled back for 2 days as the markets rallied. This disconnect with the markets, and even with the dollar tanking and testing lows on Tuesday, oil still dropped. Now with the dollar positioned to bounce, and it generally bounces pretty hard, the market remains vulnerable for a pull back.
When these market advances pull back, they're often short and hard. I've often written articles titles 1 day, x weeks, where you get one day or one week where you wipe out a significant amount of the previous action.
That being said, the internals backing off here do offer the contrary positioning that the market will continue higher on internal improvement (it's not always a negative sign, unless it results in lower prices). For example, one of the most concerning sell signals in the market is when the 10 day is moving higher, but the new highs and new lows are increasing to what's called a crash level - or the Hindenburg Omen. We have these charts in the data base. So we'll accordingly move into Buy Trend Move, noting the potential of a reversal lower.
I also do postmortems on my failed trades or failed advice because 1) it's part of the learning process of the brain (which I periodically write about) and 2) so as to improve my advice going forward - and I'll be writing more about these postmortems in the future.
So when the LTRO came out this morning, it established a high and low in the premarket, across most key vehicles (dollar, bonds, stocks) - and these levels for the most part not being violated this am, and then the Fed coming out suggesting they're still not sure about the market (thus getting back to my advice on the bigger picture leading economic indicators) here's my advice:
We are still cautious on the market here. The close is very critical. If we move into Buy Mode, I'll advise intra day. Until then, we still see the magnitude potential move lower with higher profit potential than playing the shorter term frequency move higher.
If you're not a member of our free weekly mailing list, feel free to sign up by clicking here.
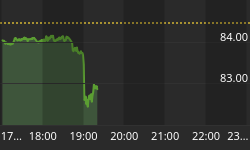
Here's a look at the global markets:

On the economic front, here is the schedule for this week. Pay close attention to the timing of the report and the potential for the markets to make short term reversals at those points.

On to the charts:

Stock Barometer Analysis
The barometer has ticked above the 5 day which would put us in Buy Mode, however, we'll remain in Sell Mode looking for a 1-2 week correction into 3/16. Note, 3/10 is a 9 month cycle low.
If we move into Buy Mode, I'll advise intra day.
The Stock Barometer is my proprietary market timing system. The direction, slope and level of the Stock Barometer determine our outlook. For example, if the barometer line is moving down, we are in Sell Mode. A Buy or Sell Signal is triggered when the indicator clearly changes direction. Trend and support can override the barometer signals.
Money Management & Stops
To trade this system, there are a few things you need to know and address to control your risk:
- This system targets intermediate term moves, of which even in the best years, there are usually only up to 7 profitable intermediate term moves. The rest of the year will be consolidating moves where this system will experience small losses and gains that offset each other.
- This system will usually result in losing trades more than 50% of the time, even in our best years. The key is being positioned properly for longer term moves when they come.
- Therefore it is vitally important that you apply some form of money management to protect your capital.
- Trading a leveraged index fund will result in more risk, since you cannot set stops and you cannot get out intraday.
Accordingly;
- Make sure you set your stops so that you can lose no more than 2% per trade (based on the QQQQ if you're trading leveraged funds and options with our trading service).
Potential Cycle Reversal Dates
2012 Potential Reversal Dates: 1/12, 1/27, 2/16, 2/23, 3/16. These dates have an accuracy of +/- 2 days. We publish dates up to 2 months in advance.
If 2/23 gets confirmed as a top, we see a move lower into 3/16. That would actually be in line with a 9 month cycle low date. This is a year with 2 9-month cycle lows. If the first one has no impact, the second one should have more. Much more...
Subscribers to our IRG Market Timing and Sentiment data service can see the performance of these forecast turn dates going back to 2005 and for the remainder of 2012.
My Additional timing work is based on numerous cycles and has resulted in the above potential reversal dates. These are not to be confused with the barometer signals or cycle times. However, due to their past accuracy I post the dates here.
2011 Potential Reversal Dates: 1/15, 1/29, 2/16, 3/10, 3/18, 4/6, 5/21, 5/31, 6/13, 6/24, 7/16, 8/1, 8/19, 9/4, 9/25, 10/21, 10/25, 11/25, 12/26.2010 Potential Reversal Dates: 1/19, 1/28, 3/2, 3/23, 4/7, 5/30, 6/10, 6/28, 7/10, 8/13, 9/7, 10/2, 10/27, 11/21, 12/19. 2009 Published Reversal Dates: 1/20, 2/11, 3/7, 3/15, 4/8, 4/16, 4/27, 5/7, 6/8, 7/2, 7/17, 9/14, 10/10, 10/24, 11/12, 11/30, 12/9, 12/21, 12/29. 2008 Potential Reversal Dates: 12/31, 1/11, 2/1, 2/13, 3/6, 4/5, 4/22, 5/23, 6/6, 6/27, 7/13, 9/2, 10/3, 10/22, 11/10, 12/11. 2007 Potential Reversal Dates: 1/10, 1/14, 1/27, 1/31, 2/3, 2/17, 3/10, 3/24, 4/21, 5/6, 6/15, 8/29, 10/19, 11/29, 12/13, 12/23, 12/31, 1/11/08. 2006 potential reversal dates: 1/16, 1/30, 2/25, 3/19, 4/8, 5/8, 5/19, 6/6(20), 7/24, 8/20, 8/29, 9/15, 10/11, 11/28. 2005 Potential reversal dates: 12/27, 1/25, 2/16, 3/4, 3/14, 3/29, 4/5, 4/19, 5/2, 6/3, 6/10, 7/13, 7/28, 8/12, 8/30-31, 9/22, 10/4, 11/15, 11/20, 12/16.
Timing Indicators
Use the following Timing/momentum indicators to assist in your trading of the QQQQ, GLD, USD, USO and TLT. They are tuned to deliver signals in line with the Stock Barometer and we use them only in determining our overall outlook for the market and for pinpointing market reversals. The level, direction, and position to the zero line are keys in these indicators. For example, direction determines mode and a buy signal 'above zero' is more bullish than a buy signal 'below zero'.
QQQQ Timing Indicator (NASDAQ:QQQQ)
The QQQQ Spread Indicator will yield its own buy and sell signals that may be different from the Stock Barometer. It's meant to give us an idea of the next turn in the market.
Gold Timing Indicator (AMEX:GLD)
Want to trade Gold? Use our signals with the Gold ETF AMEX:GLD. Gold gives us a general gage to the overall health of the US Economy and the markets.
US Dollar Index Timing Indicator (INDEX:DXY)
Want to trade the US Dollar? Use our signals with the Power Shares AMEX:UUP: US Dollar Index Bullish Fund and AMEX:UDN: US Dollar Index Bearish Fund.
Bonds Timing Indicator (AMEX:TLT)
Want to trade Bonds? Use our signals with Lehman?s 20 year ETF AMEX:TLT. The direction of bonds has an impact on the stock market. Normally, as bonds go down, stocks will go up and as bonds go up, stocks will go down.
OIL Timing Indicator (AMEX:USO)
Want to trade OIL? Use our signals with AMEX:USO, the OIL ETF. We look at the price of oil as its level and direction has an impact on the stock market.
Secondary Stock Market Timing Indicator

We daily monitor hundreds of popular and proprietary technical indicators that break down market internals, sentiment and money flow to give us unique insight into the market. We feature at least one here each day in support of our current outlook.
As a subscriber to the Daily Stock Barometer System at the $50 level, you also get access to all our charts and research. Email Carl@stockbarometer.comto upgrade your subscription.
Daily Stock Market Outlook
We remain in sell mode, looking for the markets to move lower into 3/16.
There are a lot of cross currents getting priced into the market very dramatically right now. I'd be very cautious here and will advise on any position changes intra day, if necessary.
Remarkable things to note, here's the equity put call ratio - people are positioning their stocks for more downside. This is generally bullish.

Here's what Fidelity is showing it's clients right now:

And I'm still a bear on gold. Here's why:

Here's our current positioning.
- Last Recommendation - 1/24 - Sell Signal/Short qqq
- Status - Stopped Out
- Consideration - Reenter short position on qqq close below 9dma (63.92)
Retirement Advisory
2/3 Long Exposure. Move to 1/3 on a SPY close below 135.5. Move to cash on a SPY close below 133.17. We remain on a longer term put cash to work signal from September, 2010. However, we're beginning to see the potential for weakness. We do not have a potential crash signal at this time.
Subscribers to our Market Timing and Sentiment data service can access our bond stock rebalance model, long term cash buy signals and crash alerts on the NYSE and NASDAQ updated weekly.
As we consolidate the Retirement Plus 1-2-3 Service into the Daily Stock Barometer, look here for advice on long term signals to put cash to work, bond/stock reallocation signals and cautionary crash warnings on the stock market.
If you want to learn more about some of my models and indicators, I use my blog to cover them in more detail. If you're looking for more information, please visit our blog - I'll have updates and publish other articles there. http://investmentresearchgroup.com/Blog/
Regards,


