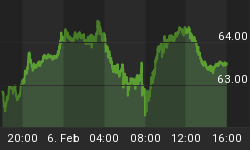
On Feb 29, gold fell $100 an ounce from a high of $1790 to a low of $1688. Numerous breathless conspiracies abound, but most center on the dastardly (to gold longs) deed of selling futures contracts naked. That is selling "paper gold" in order to suppress the price, and then hope to buy back after the price falls.
I will leave it to anyone who has studied Econ 101 to debunk the idea that selling will cause the price to drop but that the subsequent buying would not cause the price to rise back to the same level.
I want to focus on a different problem with this hypoxic assertion. If someone sold futures naked, then one could see that in the gold basis. The gold basis is basically (no pun intended) the spread between the price of a gold futures contract minus the price of gold for spot delivery. Selling one, but not the other, would do two things. First, it would increase the open interest in gold futures. This is the number of contracts outstanding. Second, it would change the basis. The basis would fall. Sure enough as this graph shows the basis for each of the moths Apr, Jun, Aug, and Dec futures fell (ignoring the cobases, which are the lines on the bottom of the chart).
There is another piece of evidence. Open interest is quoted daily for each contract. This table shows open interest before and after this correction, for all four months (which represent the vast majority of the gold futures contracts outstanding).
| Month | Before | After |
| April | 270,183 | 252,192 |
| June | 65,492 | 65,522 |
| August | 24,793 | 25,230 |
| December | 31,474 | 31,603 |
We see no significant change in June, August, or December. The big change is April. In April, open interest declined 6.7%. This was not selling of new futures, dumped onto the bid to suppress the price. This was panicky or overleveraged longs liquidating (i.e. selling onto the bid to get out of gold).
It is worth noting that virtually every asset category fell at the same time as gold, starting around 10am EST that day.
I want to discuss one other thing about gold. There is a noticeable falling trend to the basis that begins around January 9. The price of gold had been in a rising trend from $1615 to $1790 just before the correction. A rising price with a falling basis means that the price was driven up by buying of physical gold, rather than buying of futures. This is confirmed by the basis falling sharply during the correction.
This is a good time to buy gold. In this author's opinion, gold got whacked along with everything else due to the marginal withdrawal of credit. This forced some "naked paper longs" to liquidate, which triggered sell-stops, and so on. But the demand for the physical metal, meanwhile, continues apace.
Let's take a quick look at silver. Silver was whacked twice as badly as gold, from 36.37 to a low of 33.68 in two hours. The silver basis chart shows a different picture than gold.
Silver's bases had been rising from January 9. This means that silver's price was rising, unlike gold, due to buying of futures. This is a bearish dynamic because it means that the marginal bidder on physical silver is the warehouseman who buys physical and simultaneously sells a future. Silver was being bought to carry. What can be bought on leverage, and what can be stuffed into warehouses, can come out again.
Silver's sharp correction of around 7.4% was the result.
I drew lines under the low points of the bases, to show that silver bases fell sufficiently to break out of its rising channel (a move which has been extended on March 2 and March 5). The flush in futures did not affect the demand for physical metal; with the net result that silver's basis has fallen rapidly since February 29. This is a bullish change to what had been a bearish chart.


