


3/8/2012 9:58:28 AM
Here's what it means for the markets.
Good Morning Complimentary Newsletter Readers. Here is this Morning's Daily Stock Barometer. We have recently released our research as the primary driver of our subscriptions - as the research covers so much more than we can advise you in the Daily Stock Barometer. While cost has increased - the value has increased significantly. If you'd like to access our data for only $1 for 4 weeks - visit my blog here to sign up.
OK, before you think I've gone off the deep end, I was reading a report discussing how solar flares have a negative impact on financial markets. Sound bizarre? Well, the report was written by the Atlanta Fed, and they show a high correlation to Flares and downside action in stocks in the week following. Now I don't have a 'flare indicator' so I can't say I can prove a similar correlation - so we'll leave it at that. But it would be interesting, because it lines up with my call for a move lower into next Friday before the next advance can start. I'll share the report up on my blog after I do a bit more research, so look for it next week.
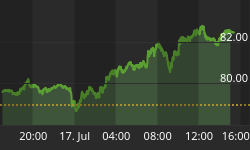
Here's a look at the global markets:

On the economic front, here is the schedule for this week. Pay close attention to the timing of the report and the potential for the markets to make short term reversals at those points.

On to the charts:

Stock Barometer Analysis
The barometer remains in sell mode, we're looking for a move lower into 3/16.
Wednesday bounce came on buying that was over done. That level of buying can be initiating or terminal, meaning it may be a signal that a new advance is starting, or that we've seen the top. Only time will tell.
The Stock Barometer is my proprietary market timing system. The direction, slope and level of the Stock Barometer determine our outlook. For example, if the barometer line is moving down, we are in Sell Mode. A Buy or Sell Signal is triggered when the indicator clearly changes direction. Trend and support can override the barometer signals.
Money Management & Stops
To trade this system, there are a few things you need to know and address to control your risk:
• This system targets intermediate term moves, of which even in the best years, there are usually only up to 7 profitable intermediate term moves. The rest of the year will be consolidating moves where this system will experience small losses and gains that offset each other.
• This system will usually result in losing trades more than 50% of the time, even in our best years. The key is being positioned properly for longer term moves when they come.
• Therefore it is vitally important that you apply some form of money management to protect your capital.
• Trading a leveraged index fund will result in more risk, since you cannot set stops and you cannot get out intraday.
Accordingly;
• Make sure you set your stops so that you can lose no more than 2% per trade (based on the QQQQ if you're trading leveraged funds and options with our trading service).
Potential Cycle Reversal Dates
2012 Potential Reversal Dates: 1/12, 1/27, 2/16, 2/23, 3/16. These dates have an accuracy of +/- 2 days. We publish dates up to 2 months in advance.
We see a move lower into 3/16, which is also options expiration. 3/10 is a 9 month cycle low.
Subscribers to our IRG Market Timing and Sentiment data service can see the performance of these forecast turn dates going back to 2005 and for the remainder of 2012.
My Additional timing work is based on numerous cycles and has resulted in the above potential reversal dates. These are not to be confused with the barometer signals or cycle times. However, due to their past accuracy I post the dates here.
2011 Potential Reversal Dates: 1/15, 1/29, 2/16, 3/10, 3/18, 4/6, 5/21, 5/31, 6/13, 6/24, 7/16, 8/1, 8/19, 9/4, 9/25, 10/21, 10/25, 11/25, 12/26.2010 Potential Reversal Dates: 1/19, 1/28, 3/2, 3/23, 4/7, 5/30, 6/10, 6/28, 7/10, 8/13, 9/7, 10/2, 10/27, 11/21, 12/19. 2009 Published Reversal Dates: 1/20, 2/11, 3/7, 3/15, 4/8, 4/16, 4/27, 5/7, 6/8, 7/2, 7/17, 9/14, 10/10, 10/24, 11/12, 11/30, 12/9, 12/21, 12/29. 2008 Potential Reversal Dates: 12/31, 1/11, 2/1, 2/13, 3/6, 4/5, 4/22, 5/23, 6/6, 6/27, 7/13, 9/2, 10/3, 10/22, 11/10, 12/11. 2007 Potential Reversal Dates: 1/10, 1/14, 1/27, 1/31, 2/3, 2/17, 3/10, 3/24, 4/21, 5/6, 6/15, 8/29, 10/19, 11/29, 12/13, 12/23, 12/31, 1/11/08. 2006 potential reversal dates: 1/16, 1/30, 2/25, 3/19, 4/8, 5/8, 5/19, 6/6(20), 7/24, 8/20, 8/29, 9/15, 10/11, 11/28. 2005 Potential reversal dates: 12/27, 1/25, 2/16, 3/4, 3/14, 3/29, 4/5, 4/19, 5/2, 6/3, 6/10, 7/13, 7/28, 8/12, 8/30-31, 9/22, 10/4, 11/15, 11/20, 12/16.
Timing Indicators
Use the following Timing/momentum indicators to assist in your trading of the QQQQ, GLD, USD, USO and TLT. They are tuned to deliver signals in line with the Stock Barometer and we use them only in determining our overall outlook for the market and for pinpointing market reversals. The level, direction, and position to the zero line are keys in these indicators. For example, direction determines mode and a buy signal 'above zero' is more bullish than a buy signal 'below zero'.
QQQ Timing Indicator (NASDAQ:QQQ)
The QQQQ Spread Indicator will yield its own buy and sell signals that may be different from the Stock Barometer. It's meant to give us an idea of the next turn in the market.
Gold Timing Indicator (ARCX:GLD)
Want to trade Gold? Use our signals with the Gold ETF AMEX:GLD. Gold gives us a general gage to the overall health of the US Economy and the markets.
US Dollar Index Timing Indicator (INDEX:DXY)
Want to trade the US Dollar? Use our signals with the Power Shares AMEX:UUP: US Dollar Index Bullish Fund and AMEX:UDN: US Dollar Index Bearish Fund.
Bonds Timing Indicator (AMEX:TLT)
Want to trade Bonds? Use our signals with Lehman?s 20 year ETF AMEX:TLT. The direction of bonds has an impact on the stock market. Normally, as bonds go down, stocks will go up and as bonds go up, stocks will go down.
OIL Timing Indicator (AMEX:USO)
Want to trade OIL? Use our signals with AMEX:USO, the OIL ETF. We look at the price of oil as its level and direction has an impact on the stock market.
Secondary Stock Market Timing Indicator

We maintain hundreds of popular and proprietary technical indicators that break down market internals, sentiment and money flow to give YOU unique insight into whether you should BUY or SELL the market. We feature at least one here each day in support of our current outlook.
As a subscriber to the Daily Stock Barometer System at the $50 level, you also get access to all our charts and research. Email Carl@stockbarometer.com to upgrade your subscription.
Daily Stock Market Outlook
We remain in sell mode, looking for the markets to move lower into 3/16.
More on the solar flares, they tend to impact small caps more than large caps and they tend to cause favor in less risky assets. So could be see a bond surge here? Well, we're not seeing it right now, as bonds tested lows. But the day isn't over yet. And we do have the Greece Issue coming to resolution this afternoon.
I'm always looking for levels in the indicators that relate to previous levels where reversals occurred. That's why I showed the VIX put call ratio above. Traders are betting on a drop in the vix. Sometimes these things are used as hedges, sometimes as a pure derivative play. You never know which is right, but always pay attention to extremes in sentiment. That's where we make our bread and butter.
Let's look more at oil:
We're reaching an extreme in CALL Buying. Those darn speculators... I see this as an opportunity to fade them.

Longer term indicator, oil volatility is relatively low. Like stocks that limits potential upside (barring an international incident) and makes a magnitude move lower more likely.

Also, a new data series we're monitoring, in our own fashion of looking at things (not theirs).

And I'll leave you with a longer term view of my own indicator - we have a sell signal below zero, which is very concerning. Now this is a longer term view, so we could peak in the next weak or so. But it does raise some caution as it has in the past. And that's my job is just to alert you to the potential.

Here's our current positioning.
- Last Recommendation - 3/5 - Re-enter Short qqq
- Status - Short QQQ
- Consideration - Maintain stop above previous swing high
Retirement Advisory
- Current positioning - 2/3 Long Exposure.
- Move to 1/3 on a SPY WEEKLY close below 135.8.
- Move to cash on a SPY WEEKLY close below 133.62.
We remain on a longer term put cash to work signal from September, 2010. However, we're beginning to see the potential for weakness. We do not have a potential crash signal at this time, although we are moving towards one.
Subscribers to our Market Timing and Sentiment data service can access our bond stock rebalance model, long term cash buy signals and crash alerts on the NYSE and NASDAQ updated weekly.
As we consolidate the Retirement Plus 1-2-3 Service into the Daily Stock Barometer, look here for advice on long term signals to put cash to work, bond/stock reallocation signals and cautionary crash warnings on the stock market.
Other advice - When I developed the barometer, it was the primary source of my advice. However, my research has broadly covered more and more such that I'm looking to help more people with more advice. I added Retirement Advice, because I think this is an area where people can make longer term decisions like rebalancing and when to put long term cash to work - (DO not to trade in retirement accounts - remember, if you do trade in your retirement account, be very careful - I NEVER RECOMMEND THIS).
So here's another thing I would advise on. As someone who drives a lot, and has oil heat, I always watch the price of oil to time my buys. The main vehicle available to us is the USO (or DTO and UCO for those who want leverage). We're going to add a OIL/GAS Hedge advice - to help the average person offset the potential rise in oil prices on their budget. We're by no means near where you would consider a position. And it would only be a short term hedge (less than one year). But the market periodically offers these opportunities and I want to find as many uses for my research to help the average person.
If you can think of any more advice you would need, let me know. If I haven't developed an indicator for it, I'm sure I can.
If you want to learn more about some of my models and indicators, I use my blog to cover them in more detail. If you're looking for more information, please visit our blog - I'll have updates and publish other articles there. http://investmentresearchgroup.com/Blog/
Regards,


