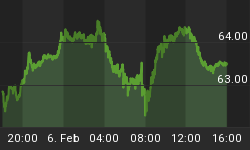
Yesterday Mr Bernanke has made quite clear that he wants a lower USD and a higher equity market.
Since I don't believe in miracles the odds that yesterday's up leg belongs to, in the least bearish scenario, a wave (B) of a Flat EWP are almost nil.
The USD Index will soon test a trend line support, if it is breached the odds that price will drop to test the February lows would be large.
With a lower USD Index we know the Risk Trade will be "switched on". Therefore this scenario would most likely trigger another leg higher of the equity market & commodities.
USD Index weakness should strengthen the option that EUR is unfolding a Double Zig Zag Wave (B) with a projected target at 1.3864
The odds that this scenario is the correct one are increasing. Therefore as long as price does not breach the last higher low at 1.3187 it is now my primary short-term count.
The Alt Count is the Triangle Idea:
Regarding SPX, if even a mild correction has been forbidden than I have to accept to consider that the wave (A) from the October 4 lows is not finished yet.
On Sunday I mentioned:
"Now the question is where the wave (A) will top?
Of course it depends upon when Central Bankers will decide that the market is due for a breather. In the mean time I can say that if price clears the 1406 horizontal resistance the next obvious potential stopping point is located in the 1440 zone. Given the well-known exogenous stimulus, if price also breaks the 1440 area then there is "only thin air" until the upper Trend Line Resistance in the area of 1500."
Below you can see in the monthly chart 3 resistance layers: 1406 - 1440 & 1500 (if price reaches the upper TL Resistance).
SPX 1500 is 5.9% higher from yesterday's eod print.
NDX could reach the next resistance area at 2900, which represents 4.4% raise from current levels.
If the assumed SPX wave (A) has more business to the upside it means that the impulsive up leg off the November 25 low is not finished yet then as I mentioned in the weekend up date: "On the other hand if the EWP is "another bear trap" then even if it could sound " science fiction" price could unfold another impulsive or ending diagonal 5-wave up leg."
Therefore barring an immediate reversal of the EUR, as long as SPX last higher low at 1386.87 is not breached this scenario, in my opinion, should be seriously considered as feasible.
In the technical front:
- Momentum Indicators: Honestly they don't have a bullish look mainly since the RSI has a huge overhead resistance at the Trend Line that has marked a negative divergence since February.
- McClellan Oscillator has barely recovered above the zero line but a bearish cross of MA is still in force.

- Weekly Summation Index: I have mentioned several times that despite SPX price has been violating logical "gravity lows" which have been suggesting at least a "mild pullback" the Summation Index has entered the oversold zone. Now we have to pay an extremely close attention at this week's eod print since a bullish cross of the weekly stochastic could trigger a multi-week buy signal

Yesterday I also mentioned that:
"Last week's pullback unfortunately is also corrective; you have to be creative in order to come up with an impulsive labelling, and creativity is a dangerous feature in EW analysis. Therefore Bears have to pray that Mr Market has begun a corrective pullback. The trend reversal will have to be corroborated by a lower high in the next few days. Keep also in mind that as we approach month & quarter end the market's bias will most likely be bullish."
Therefore, once again Bears have nothing and without a miracle the trend is still up.


