


It has been my expectation for some time now that the market is forming a Head and Shoulders Topping Pattern. This particular pattern will often times frustrate investors by its lack of direction, and sideways structure. At this point, especially with Friday's early morning sell-off, it could be that we are not only better defining the Head of the Pattern, but marking a Major top in the Stock Market. I'm going to step out here on a limb and call the top at 1419.75 in the S&P Futures market, and here's why.
After the release of disappointing economic data on friday morning, the Dow futures dropped 60 points in less than 30 seconds. If that wasn't enough to "freak out" anyone, the market continued its decline by selling off another 60 points to close out the 45 minutes of trading. Now, had this news been presented on a day that was tradable to the public, my guess is the cash market would be down somewhere between 100- 150 points, minimum. So that leaves Monday as the next available option. To add to these aforementioned bearish implications, it might also be important to mention that prices are resting on the intermediate trendline dating back to the October lows. If we break this trendline, not only does that suggest a change in trend, but it will also reveal the early stages of this next decline coming.
The initial sell-off is usually a sharp decline that gets a lot of attention. "The Dippers" who I call the crowd that buy every dip, will buy this next bounce assuming it's a buying opportunity. Only this time my friends, it's the last chance you have to get out before the next selling phase. The difference between the first sell-off and the one after boils down to the degree of selling pressure. Lets just say that you may need a trash can by your desk if you wake up one morning to see the Dow down 300-400 points. It unfolds as a waterfall decline, or a panic sell-off that raises the talk among all the news outlets, talking heads, and mom and pop store owners at a town near you. To put it simply, it generates enough talk to even suggest for an intervention of some kind, possibly a government intervention.Let's face it, with as bad as the economy is right now, the only way this market sustained any uptrend has been because the printing press spicket was turned back on. It's Bernanke's only tool, but the next drip out of that faucet will coincide with the single best buying opportunity for the remained of this year.
S&P Mini - Daily Chart

Russell Futures - Daily Chart

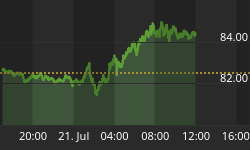
The Dow Jones Futures - Daily Chart


