


4/24/2012 8:58:11 AM
Each type of market move has several characteristics that give you clues.
We'll discuss some of them below. But before we do, let's look at the next few days, because this is a pretty interesting time in the markets as we have a confluence of events that are coming into play.
Tonight we get Apple's earnings. Tomorrow we get the Fed's decision - and while nothing is expected, the language will be hyper-analyzed. That sets up a counter fed trade. And tomorrow is also our Key Reversal Date. So while I am bearish, the potential for some wild action is upon us.
Click here to become a subscriber for only $1 today.
I prefer the markets to exhaust down into a bottom - and while we're seeing more extreme selling, we're not near an extreme by any means. It can happen real quick, in a matter of 1-3 days. So stay tuned...
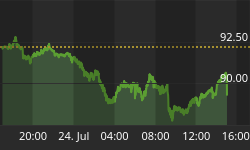
Here's a look at the global markets:

On the economic front, here is the schedule for this week. Pay close attention to the timing of the report and the potential for the markets to make short term reversals at those points.

On to the charts:

Stock Barometer Analysis
We remain in Sell Mode. The market (and barometer) has been telling us that it's weak by not being able to sustain any positive price action. That means we need to flush out more downside. How that price action plays out will tell us if we're in for a quick move - or a sustained sell off. So stay tuned...
The Stock Barometer is my proprietary market timing system. The direction, slope and level of the Stock Barometer determine our outlook. For example, if the barometer line is moving down, we are in Sell Mode. A Buy or Sell Signal is triggered when the indicator clearly changes direction. Trend and support can override the barometer signals.
Money Management & Stops
To trade this system, there are a few things you need to know and address to control your risk:
- This system targets intermediate term moves, of which even in the best years, there are usually only up to 7 profitable intermediate term moves. The rest of the year will be consolidating moves where this system will experience small losses and gains that offset each other.
- This system will usually result in losing trades more than 50% of the time, even in our best years. The key is being positioned properly for longer term moves when they come.
- Therefore it is vitally important that you apply some form of money management to protect your capital.
- Trading a leveraged index fund will result in more risk, since you cannot set stops and you cannot get out intraday.
Accordingly;
- Make sure you set your stops so that you can lose no more than 2% per trade (based on the QQQQ if you're trading leveraged funds and options with our trading service).
Potential Cycle Key Reversal Dates
2012 Potential Reversal Dates: 1/12, 1/27, 2/16, 2/23, 3/16, 4/9, 4/25, 5/26. 6/2, 6/15. These dates have an accuracy of +/- 2 days. We publish dates up to 2 months in advance.
Our next date of 4/25 aligns with the Fed meeting. Could we get hopes of QE3? Then our next date is 5/26 - so whatever happens on 4/25, could set the stage for the next month.
Our IRG Market Timing and Sentiment data service shows the performance of these forecast turn dates going back to 2003 and for the remainder of 2012.
My Additional timing work is based on numerous cycles and has resulted in the above potential reversal dates. These are not to be confused with the barometer signals or cycle times. However, due to their past accuracy I post the dates here.
2011 Potential Reversal Dates: 1/15, 1/29, 2/16, 3/10, 3/18, 4/6, 5/21, 5/31, 6/13, 6/24, 7/16, 8/1, 8/19, 9/4, 9/25, 10/21, 10/25, 11/25, 12/26.2010 Potential Reversal Dates: 1/19, 1/28, 3/2, 3/23, 4/7, 5/30, 6/10, 6/28, 7/10, 8/13, 9/7, 10/2, 10/27, 11/21, 12/19. 2009 Published Reversal Dates: 1/20, 2/11, 3/7, 3/15, 4/8, 4/16, 4/27, 5/7, 6/8, 7/2, 7/17, 9/14, 10/10, 10/24, 11/12, 11/30, 12/9, 12/21, 12/29. 2008 Potential Reversal Dates: 12/31, 1/11, 2/1, 2/13, 3/6, 4/5, 4/22, 5/23, 6/6, 6/27, 7/13, 9/2, 10/3, 10/22, 11/10, 12/11. 2007 Potential Reversal Dates: 1/10, 1/14, 1/27, 1/31, 2/3, 2/17, 3/10, 3/24, 4/21, 5/6, 6/15, 8/29, 10/19, 11/29, 12/13, 12/23, 12/31, 1/11/08. 2006 potential reversal dates: 1/16, 1/30, 2/25, 3/19, 4/8, 5/8, 5/19, 6/6(20), 7/24, 8/20, 8/29, 9/15, 10/11, 11/28. 2005 Potential reversal dates: 12/27, 1/25, 2/16, 3/4, 3/14, 3/29, 4/5, 4/19, 5/2, 6/3, 6/10, 7/13, 7/28, 8/12, 8/30-31, 9/22, 10/4, 11/15, 11/20, 12/16.
Timing Indicators
Use the following Timing/momentum indicators to assist in your trading of the QQQQ, GLD, USD, USO and TLT. They are tuned to deliver signals in line with the Stock Barometer and we use them only in determining our overall outlook for the market and for pinpointing market reversals. The level, direction, and position to the zero line are keys in these indicators. For example, direction determines mode and a buy signal 'above zero' is more bullish than a buy signal 'below zero'.
QQQ Timing Indicator (NASDAQ:QQQ)

The QQQQ Spread Indicator will yield its own buy and sell signals that may be different from the Stock Barometer. It's meant to give us an idea of the next turn in the market.
Gold Timing Indicator (ARCX:GLD)

Want to trade Gold? Use our signals with the Gold ETF AMEX:GLD. Gold gives us a general gage to the overall health of the US Economy and the markets.
US Dollar Index Timing Indicator (INDEX:DXY)

Want to trade the US Dollar? Use our signals with the Power Shares AMEX:UUP: US Dollar Index Bullish Fund and AMEX:UDN: US Dollar Index Bearish Fund.
Bonds Timing Indicator (AMEX:TLT)

Want to trade Bonds? Use our signals with Lehman?s 20 year ETF AMEX:TLT. The direction of bonds has an impact on the stock market. Normally, as bonds go down, stocks will go up and as bonds go up, stocks will go down.
OIL Timing Indicator (AMEX:USO)

Want to trade OIL? Use our signals with AMEX:USO, the OIL ETF. We look at the price of oil as its level and direction has an impact on the stock market.
Secondary Stock Market Timing Indicator

We maintain hundreds of popular and proprietary technical indicators that break down market internals, sentiment and money flow to give YOU unique insight into whether you should BUY or SELL the market. We feature at least one here each day in support of our current outlook.
As a subscriber to the Daily Stock Barometer System, you also get access to all our charts and research. Email Carl@stockbarometer.com to upgrade your subscription.
Daily Stock Market Outlook
We remain in Sell Mode, looking for the markets to move lower into Mid week.
The market characteristics I refereneced above is one of the reasons I developed so much data on market timing. The above chart shows the action between new highs and new lows on the Nasdaq. This pattern is bearish. Look out below!
The bond stock relationship is critical - the current view is bearish...

I'm always measuring the efficiency of my indicators, as their positioning tells us the likelihood of the next market move.

The indicator below tells me when individuals are piling into the market. We're starting to see that action now - really - quite possibly individuals are seeing this as a good pullback to buy. They tend to get surprised... As they tend to be wrong.

And finally, if you weren't watching natural gas, people were loading up on puts, which usually means prices will rise because they're wrong. Remeber, bulls make money, bears make money, and pigs get slaughtered - this last move in put buying were the pigs... Oink... Once they kill all the pigs, the downward move should commence.

So how do I see the next few days playing out? I belive there is a random component to the market. As news is random (and fortuitous to most) - you can not predict what the next news story will be because it hasn't happened yet. I always want my forecast to play out immediately, that's just human nature to not only want to be right, but want to be right, right now... So as much as I want the markets to just collapse lower, we could easily see a one day bounce to put more doubt in the market's downside. The market never makes it easy...
On a side note, I met with a brokerage about auto trading the barometer. This would be a service for accounts over 100k where I'd not only trade the barometer signals, but also be able to add some stocks and counter trades. If you have any interest, please let me know. jay@stockbarometer.com
Here's our current positioning.
Last Recommendation - 4/2 - Short the QQQ
Status - Short QQQ
Consideration - Maintain stop per money management above.
If you want to learn more about some of my models and indicators, I use my blog to cover them in more detail. If you're looking for more information, please visit our blog - I'll have updates and publish other articles there. http://investmentresearchgroup.com/Blog/
Regards,


