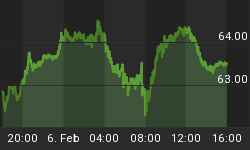
A good way to sum up the conflicting signals that the markets are giving from a short-term perspective is to look at our comments from Wednesday. Before the market opened, we posted charts that had a bullish slant. At 2:30 p.m. EDT, we said the session was weaker than it appeared.
As we reviewed the markets before the open on Thursday, a mixed picture was still the basic theme. The charts and markets below represent a good way to monitor which way the uncertainty may break in the short-to-intermediate-term. The longer-term picture still looks positive, which means we still would be looking for good entry points should the markets experience additional weakness over the next five to ten trading days.
An excellent way to monitor risk-on vs. risk-off is to review the performance of the "Fear Index" or VIX relative to the S&P 500. The VIX represents risk-off and the S&P 500 risk-on. The red arrow at the top of the chart below shows the momentum of the fear-based trade is weakening, which leans bullish for stocks. Below the green arrow, we see a lower high in the ratio and a 10-day moving average that has rolled over - these also lean toward the bullish camp for stocks. The purple arrow shows the intersection of support lines. These lines offer a good way to monitor the battle of the bulls and bears. Finally, the blue arrow also shows waning upside momentum for the fear trade relative to the risk trade.

Real Estate Investment Trusts (REITS) have recently broken to the upside (see blue arrow below). Bullish momentum is trying to stabilize (purple arrow), as measured by MACD. MACD is bullish when the black line is above the red line, as it is below. REITS also appear to have held near the upward-sloping pink trendline (green arrows). The mixed picture comes in with the rate of change (ROC) near the red arrow. A falling ROC is not what you want to see during a bullish breakout. ROC can be a laggard, so the bulls would like to see it turn up soon. If REITS can hold their breakout, it obviously favors the risk-on camp. Conversely, if the breakout fails, it sends up a warning flare for risk assets.

The weekly chart of small caps below also paints an uncertain picture in the short-term. The most potentially bullish feature of the chart below is a candlestick pattern known as "bullish engulfing". The pattern is formed when the far right candlestick "engulfs" the preceding candlestick. The preceding candlestick also shows an indecisive market with the small body and long "tails". Since this is a weekly chart, what matters is how those last two candles look at the end of the week, not as of the close on Wednesday. Another bullish element is the upward-sloping 22-week moving average (thin blue line). The green arrows show how price reacted after a bullish turn in the 22-week. The potentially bearish aspect of the small cap chart is the bearish MACD cross that is trying to form. It matters where MACD finishes the week, not that it looks weak now.

Commodities help us monitor the all-important battle between the fear of inflation and the fear of deflation, which is similar to risk-on vs. risk-off. The commodity ETF, DBC, is trying to hold near a logical point in a trend channel (see purple arrow below). A momentum shift is also potentially in the works as measured by MACD (blue arrow). Notice the black MACD line remains below the red line in a bearish manner (for now at least). The MACD in the chart below is a good way to monitor market risk in general.

Oil and gas exploration stocks (XOP) also have a bullish engulfing pattern trying to form on the weekly chart relative to the S&P 500 (see green arrow below). The blue upward-sloping trendlines represent long-term areas of potential support. Like the commodity chart above, the chart below is a good way to monitor the big picture in the short-to-intermediate-term.

Moving back to the mixed picture theme, you typically would expect emerging markets to exhibit some strength if commodities are turning up in a bullish manner. The chart below shows the performance of emerging markets (EEM) relative to the S&P 500. The purple arrow highlights numerous moving averages with bearish/negative slopes. The red arrow shows a bearish MACD cross could be imminent. Regardless of how the global markets behave going forward, unless the chart below improves, the United States still appears more attractive than emerging markets. Being a weekly chart, what matters is how it looks Friday at 4:01 p.m. EDT.


