


5/8/2012 9:12:21 AM
Textbook Decline
Here's what it means.
Sorry for the confusion my statement yesterday created. When I referenced a short term buy signal, what I was referring to was a level of selling on Friday that required the market to bounce on Monday. That has played out and if we are in a larger sell off, it should resume today. This is a short term signal that results when the selling is so high in volume and breadth, that it's lop sided.
Remember, if everyone is in a trade, then it's unlikely to work. That being said, here's more on the warning signs in the gold market:

The stock market is the ultimate poll. People vote with their money on where they see things going. This move in GOLD is way too bullish. It's one of the reasons I was bearish on oil, but not so much on gold back when the PUT buying was at an extreme. Now that the CALL buying is at an extreme, I'd be short gold big time.
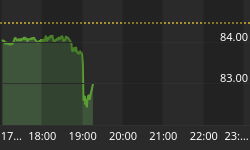
Here's a look at the global markets:

On the economic front, here is the schedule for this week. Pay close attention to the timing of the report and the potential for the markets to make short term reversals at those points.

On to the charts:

Stock Barometer Analysis
We remain in Sell Mode, looking for the markets to move lower into the end of May.
The Stock Barometer is my proprietary market timing system. The direction, slope and level of the Stock Barometer determine our outlook. For example, if the barometer line is moving down, we are in Sell Mode. A Buy or Sell Signal is triggered when the indicator clearly changes direction. Trend and support can override the barometer signals.
Money Management & Stops
To trade this system, there are a few things you need to know and address to control your risk:
- This system targets intermediate term moves, of which even in the best years, there are usually only up to 7 profitable intermediate term moves. The rest of the year will be consolidating moves where this system will experience small losses and gains that offset each other.
- This system will usually result in losing trades more than 50% of the time, even in our best years. The key is being positioned properly for longer term moves when they come.
- Therefore it is vitally important that you apply some form of money management to protect your capital.
- Trading a leveraged index fund will result in more risk, since you cannot set stops and you cannot get out intraday.
Accordingly;
- Make sure you set your stops so that you can lose no more than 2% per trade (based on the QQQQ if you're trading leveraged funds and options with our trading service).
Potential Cycle Key Reversal Dates
2012 Potential Reversal Dates: 1/12, 1/27, 2/16, 2/23, 3/16, 4/9, 4/25, 5/26. 6/2, 6/15. These dates have an accuracy of +/- 2 days. We publish dates up to 2 months in advance.
We expect the markets to move lower into 5/26. 5/15 is a 35 day trading cycle low. And 5/18 is options expirations.
Our IRG Market Timing and Sentiment data service shows the performance of these forecast turn dates going back to 2003 and for the remainder of 2012.
My Additional timing work is based on numerous cycles and has resulted in the above potential reversal dates. These are not to be confused with the barometer signals or cycle times. However, due to their past accuracy I post the dates here.
Timing Indicators
Use the following Timing/momentum indicators to assist in your trading of the QQQQ, GLD, USD, USO and TLT. They are tuned to deliver signals in line with the Stock Barometer and we use them only in determining our overall outlook for the market and for pinpointing market reversals. The level, direction, and position to the zero line are keys in these indicators. For example, direction determines mode and a buy signal 'above zero' is more bullish than a buy signal 'below zero'.
QQQ Timing Indicator (NASDAQ:QQQ)

The QQQQ Spread Indicator will yield its own buy and sell signals that may be different from the Stock Barometer. It's meant to give us an idea of the next turn in the market.
Gold Timing Indicator (ARCX:GLD)

Want to trade Gold? Use our signals with the Gold ETF AMEX:GLD. Gold gives us a general gage to the overall health of the US Economy and the markets.
US Dollar Index Timing Indicator (INDEX:DXY)

Want to trade the US Dollar? Use our signals with the Power Shares AMEX:UUP: US Dollar Index Bullish Fund and AMEX:UDN: US Dollar Index Bearish Fund.
Bonds Timing Indicator (AMEX:TLT)

Want to trade Bonds? Use our signals with Lehman?s 20 year ETF AMEX:TLT. The direction of bonds has an impact on the stock market. Normally, as bonds go down, stocks will go up and as bonds go up, stocks will go down.
OIL Timing Indicator (AMEX:USO)

Want to trade OIL? Use our signals with AMEX:USO, the OIL ETF. We look at the price of oil as its level and direction has an impact on the stock market.
Secondary Stock Market Timing Indicator

We maintain hundreds of popular and proprietary technical indicators that break down market internals, sentiment and money flow to give YOU unique insight into whether you should BUY or SELL the market. We feature at least one here each day in support of our current outlook.
As a subscriber to the Daily Stock Barometer System, you also get access to all our charts and research. Email Carl@stockbarometer.com to upgrade your subscription.
Daily Stock Market Outlook
We remain in Sell Mode, projecting a move lower into the 26th (also noting a cycle date on the 15th).
Above is a chart that shows the action of Investor's Intelligence's Buy Sell Climaxes. This is a good indicator for noting a large price action being followed by a number of stocks. This peek means we are close to, if not at a top. When will we be at a bottom? When we see the peak at the bottom. It could come in a week, a month - no one knows. That's why we watch this data every day/week and report it to you. And you can access the data yourself for your own trading decisions. There isn't a financial decision you should make without consulting the research. I know that's a pretty bold statement, but I developed these indicators for my own trading and wealth building, and that's why I make them available to you...
And if you don't see an indicator, and want meto consider it, let me know. jay@stockbarometer.com
One more chart.

The bearish pattern on the S&P will have a clear target and if the markets break down, we'll use that as a target for consideration on our Q trade. I'm actually playing thi down move with SQQQ, which moves at 3x the rate of the QQQ. I used to use QID (and QLD) - but just want to see how true the SQQQ can remain to the actual move.
That and I also see a potentially large move lower in apple, as I've been saying, similar to the GOOG move back in 2007... The parabolic moves were almost exactly the same and are playing out very similarly.
Someone asked me to comment on books that I would recommend. Most of my reading now is about how the brain works and perceives things. Here's a good on: How We Decide
Here's our current positioning.
- Last Recommendation - 5/4 - SHORT the QQQ
- Status - Short QQQ
- Consideration - Maintain stop per money management above.
If you want to learn more about some of my models and indicators, I use my blog to cover them in more detail. If you're looking for more information, please visit our blog - I'll have updates and publish other articles there. http://investmentresearchgroup.com/Blog/
Regards,


