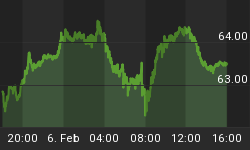
Silver added $0.184 cents this past reporting period and gold wandered down $+18.60 but do you know how they got there?
Let's look under the hood...
Here is the CME Daily Bulletin report from April 26h most significant day of last week for you to see the most active volume month (MAVM) and the 2nd most active volume month (2MAVM). See if you can spot the the MAVM and 2MAVM in this full report:
If you decide you would like to monitor these reports on a daily basis to gain technical knowledge for following trading on the COMEX gold and silver futures and options, here is where you find the reports: http://www.cmegroup.com/tools-information/build-a-report.html?report=dailybulletin
My CME daily bulletin aggregation spreadsheet is below, for reference, for the rest of this report.
On April 26th, we see the price of silver rose $+0.851 during the trading day's 24 hours. We see in the MAVM -10,752 contracts dropping out of the spot price calculation. 3,921 of those contracts went into the 2MAVM and -6,593 left the total open interest entirely. Of the 3,921 probably all of them are due to speculator short coverings and the commercials snapped up the majority of those shorts to make profit on another day, such as we have seen the last several days. Notice also in the silver COT table below that the commercials discard -4,504 shorts. But this is not the day they did that maneuver on because on a price rise the commercials are always buying shorts for their next manipulative profit spree.
In my previous article http://www.marshallswing.com/2012/04/24/gold-and-silver-manipulation-small-silver-speculators-trounced/ I explained the trading day and the manipulation attack by the commercial traders to lower the price of silver. Also explained was the somewhat unsuccessful attack though the commercials made potential millions off the attack by causing speculators to dump their longs but they bought back at lower levels and price returned to about the same point as when the day began.
Well, the commercials did almost the exact opposite on this trading day as their goal was to shake out all the shorts the speculators has purchased the prior period. The small speculators had picked up 2,798 shorts the previous period. They lost a huge amount of money to the commercials on this the 26th day of April.
The reason for the -10,752 contracts leaving the MAVM is that the 2MAVM is the next delivery month and was 2 months or in other words had to ski[p a month and sure enough this switch over happened on the 30th of April. This is very tricky business for the commercials as it is difficult to move so much open interest out of the MAVM into the 2MAVM or discard it entirely without losing control of the spot price.
What else do we see on the 26th? Notice the total volume and total 2MAVM volume are approaching being equal as the 2MAVM took over the spot price calculation on the 30th.
In the gold action, the most interesting day I see is also the 26th as we see it took 251 average mean contracts traded to effect every $1 of gold spot price change. What I also note in gold is there is a huge addition of +4,562 contracts to the total open interest. That means there was a big battle for the spot price in gold but it was less dramatic as the one in silver and less successful in gold for the day.
And we see that played out in the gold chart for that day:
And not to be left out, here is the silver chart for the period:
I leave you to the rest of the numbers! If you have general questions, you can reach me atwww.MSwing@MarshallSwing.com Answers will be posted on the website for all to see.


See you next week,


