


Today another short update since I don't have much new to add from previous updates.
Like I did yesterday today's technical update begins with a brief look at the EUR, since "she" is the "mainstay" for an oversold rebound of almost everything.
If the EUR does not provide assistance to the Bull's cause then forget about some type of a bottom for the equity & commodity markets.
But barring a crash overextended moves are usually at some point corrected adjusting the "tilt" of the abrupt decline.
Today the EUR daily RSI is at 22 while the Stochastic is at 5.
But despite extreme oversold readings of momentum indicators and a potential bottoming candlestick (Doji), the internal structure is extremely weak. Therefore as long as price does not establish a higher high above yesterday's hod at 1.2759 the risk remains high for lower prices and we cannot rule out a test at the January low = 1.2622.
As I mentioned yesterday I lost confidence on a particular count but I am closely monitoring it for indications of some type of a bottom.

Obviously if the EUR should be involved in attempting to establish some "type" of a bottom Gold should be doing the same.
As you can see in the weekly chart below price has reached a critical support line at 1522. It will be interesting to see the weekly candlestick by eod tomorrow.

Now lets go to the SPX.
Yesterday I mentioned that the equity market momentum and breadth indicators were getting oversold, well today they are even more oversold and several indicators are piling up flashing warnings of "enough oversold?"
Yesterday I posted a chart of the 10d MA of NYSE Adv-Dec Volume. Today I show the NYSE % of stocks above the 50 dMA, as you can see it has dropped to the November's low.

So we know that the equity market is oversold and due for at least a multi-day relief rebound, everybody is expecting one but Mr. Market seems to be "as deaf as a post" and keeps grinding lower, every single attempt does not find any buying interest.
Yesterday's candlestick is an Inverted Hammer, in an extended down trend it is considered as a potential bottoming candlestick but again it only flashes a warning.
There are not many support areas left above 1300, which belongs to the upper range of my potential target box 1300 -1277.
I can highlight 1321 and a gap at 1312.40
Elliot Wave wise the absence of an impulsive decline or an Ending Diagonal suggests that price has not established yet a tradable bottom.

Maybe what is needed is a final "flush out" which would allow a selling exhaustion and capitulation.
So I am waiting for a price pattern to confirm the overdue bottom.
Regarding the short-term SPX price action, the structure has morphed into a messy and unclear pattern so I prefer to switch to NDX. Here, from the May 11 peak, we could have an impulsive move in progress or the early stages of an Ending Diagonal. But again the EWP does not seem completed yet.

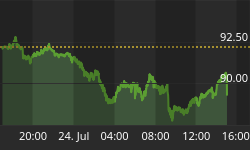
The chart of VIX neither gives a clear clue. It is has an overbought Stochastic while the last 3 consecutive candlesticks are pressing at the upper BB but there is no indication of a potential top yet.

To sum up:
- Momentum and Breadth indicators are suggesting that price should be on the verge of establishing some type of a bottom that will allow at least a multi-day rebound.
- Price does not have a clear ending pattern yet.
- Therefore the risk of more down side action is still high.
- We are probably still missing a capitulation move.


