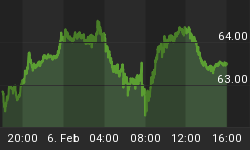
We have a short-term tag of war between SPX's EWP, which is suggesting that price is attempting to carry out a "relief bounce" and the EUR, which has lost the horizontal support at 1.2622 and it is breaching a long-term trend line support in force since the 2000 lows.
As it can be seen in the monthly chart below the next support is located in the area of 1.2460 then there is virgin area until the 0.382 retracement of the entire rally from the October 2000 lows at 1.2128.
Clearly, my preferred scenario for SPX, which calls for a wave (B) multi-day rebound, in order to play out, needs that the EUR finds urgently a short term bottom.
Without analyzing the long term EWP, if we take into account only the down leg from the May 2011 lower high in my opinion the wave structure is corrective and so far it seems quite reasonable to consider that price could be unfolding a Double Zig Zag. If this count is correct then price should be now involved in the infancy stages of the last wave (c) down. Recall that a wave (C) has to be impulsive or it has to trace an Ending Diagonal.
Therefore, even without a confident count price seems it is far from a potential long lasting bottom and this will exercise downside pressure for the equity market. The EUR weakness would be aligned with SPX scenario of a larger correction from the April top.
In the weekly chart below I have the potential Double ZZ scenario. We can see that if price does not stop the down leg in progress at 1.2467 then there are no more supports left above the 0.382 retracement at 1.2128.
Now lets go the SPX chart.
I maintain the short-term scenario that I have been explaining in the last few days which calls for a countertrend rebound with a target in the range 1340-1357. At the same time the potential larger corrective EWP could establish an important bottom in the range 1258-1220.
If this scenario plays out price should not breach the trend line from the 2009 lows.
Below I have the potential longer term "map":
Regarding the shorter term EWP, I maintain the EW count that calls for a Double Zig Zag in progress from the April 2 top. If this count is correct, last Friday price has completed the wave (A) of the second Zig Zag, then now it should be involved in a wave (B) counter trend rebound with a potential target in the range 1339 - 1357.
The assumed wave (B) could unfold a Zig Zag / Double ZZ / Triangle.
Market breadth and momentum, so far are supporting my preferred scenario.
- The McClellan Oscillator is rising towards the zero line despite price has not confirmed yet the kick off of a larger rebound.

- Momentum Indicators are also suggesting that a short-term bullish scenario is feasible. We have a bullish cross of the Stochastic and a positive divergence of the RSI.
To sum up:
-
Yesterday strong reversal indicates that for the time being price is not willing to breach the critical pivot support at 1292.
-
If the EW count that I am following is correct then we could have a multiday rebound with a target in the range 1339-1353. Probably, time wise it will extend into next week.
-
The EUR`s EWP suggests more down side ahead. For the short-term, if my scenario plays out the EUR has to establish some type of a short-term bottom in the area of 1.2460.


