


My SPX long-term count remains unchanged.
As long as price does not prove it erroneous I maintain that from the November 2008 lows, price is unfolding a counter trend large wave (X).
The wave (X) is not over yet as it is tracing a Zig Zag from the October 2011 low. This assumption is the critical one since it will confirm or deny my long-term preferred count.
If the wave (X) is now involved in the final Zig Zag then price now has to confirm that it is tracing a wave (B), by maintaining a corrective EWP and by not breaching the Trend Line Support in force since the March 2009 low.
Therefore so far the EW "map" is on track:

What is not possible to know in advance is if the current down leg off the April 2 top will establish the bottom of the entire wave (B) or the potential low point of a larger corrective pattern, in case the EWP evolves into a flat or a triangle.
Once the EPW from the April 2 top is completed, even if it does not establish a major bottom I expect a large counter trend rebound.
The validity of a major bottom will require positive divergences of market breadth & momentum indicators, extreme bearish sentiment & of course a reversal of the USD end the Bonds.
- Positive Divergences of Market Breadth & Momentum Indicators.
So far we don't have any indication that within the current down leg we will have positive divergences:
Monthly Momentum:
The RSI is already approaching the long-term trend line support.
The Stochastic has issued on May a new sell signal.
The MACD is on the verge of issuing a sell signal.

Weekly Momentum:
The RSI on May has breached the zero line with a sequence of lower highs/lows.
The Stochastic has a sell signal in force since the end of March and is now entered the oversold zone.
The MACD has a sell signal in force since the beginning of May.

Summation Index:
We do have a positive divergence of the RSI. But the index, despite being extremely oversold, keeps making lower lows.
An oversold rally could be expected.

Bearish Sentiment
Judging from the last Investor's Intelligence survey the bull ratio remains too high.

The AAII bull ratio remains low but not at en extreme low reading.

- USD Index
The long term EWP looks more bearish than bullish. We can make the case that from 1987 price has traced a 3-wave down leg, followed by a sideways since the April 2008 low.

The pattern from the May 2011 low is clearly corrective therefore we know that price has not established a major bottom.
The EWP is very complex, but we can deduce that it is tracing a 7 -wave up leg, which would imply a Double Zig Zag.
If this count is correct then price is unfolding the wave (C) of the second Zig Zag. The internal price structure does not look impulsive then maybe it will unfold an Ending Diagonal like the wave (W).
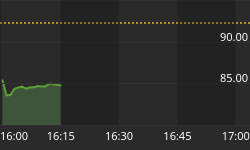
The projected target could be located in the range 85.85 - 90.29.

Sentiment on the USD has risen to extreme readings, usually the odds of a reversal increase when everyone is bullish.

- US 30 YR Bond
Price could be getting close to complete a massive bearish rising wedge

In addition Bond bullish sentiment is approaching readings where a reversal can occur.

Conclusion:
- We don't have any indication from momentum-breadth indicators and sentiment that price is approaching a major bottom.
- The USD index could be tracing the last wave (C) up of a double ZZ from the May 2011 low.
- The 30 yr Bond could be getting close to a major top.
Then maybe SPX is approaching an important bottom (but not THE BOTTOM)
Lets go back to the SPX charts.
On Friday due to the NFP miss price collapsed. The 1292 critical support was breached and not even the 200 d MA was able to hold back the selling pressure.
Certainly the loss of the 200 d MA is a big negative signal and could trigger "panic selling" in the days ahead.
Regarding the EW count from the April 2 top I maintain my preferred count that calls for a Double Zig Zag in progress, with price now tracing the final wave (C) down.
If this count is correct price could be heading to the low 1200's.
The projected 1 x 1 extension target is at 1211.60

The assumed wave (C) has to unfold an impulsive decline or an ending Diagonal. So far we only have a 3 -wave down leg, therefore we can conclude that there is more down side to come ahead.

VIX is getting close to the Inverted Head & Shoulder target at 28.50 while the RSI has a negative divergence. There is no indication of an imminent reversal but it could be losing upside momentum.
Next week we have to monitor if the 200 d MA will become a strong support.

Important bottoms usually are "nourished" by "news"
During the month of June we have the following important dates:
-
June 6 Governing Council meeting of the ECB.
-
June 17 Greek elections.
-
June 20 FOMC meeting.
-
June 21 Governing Council and General Council meeting of the ECB.
It seems reasonable to expect that both the FED and the ECB will have to come to the rescue once again. Maybe once the Greek elections are out of the way.


