


We know that Central Bankers will step in "if necessary".
In the mean time Europe should establish a serious plan to resolve the Eurozone crisis before the end of June.
Uncertainties regarding the Greek elections on the 17th of June will probably regain market attention.
Yesterday SPX achieved a surprising rally, recovering with apparent easiness the 200 d & the 10 d MA and it did even close last Friday's NFP gap down at 1310.33.
The 20 d MA = 1318.50 remains as the critical obstacle that price has to regain in order to increase the probability that the entire EWP from the April 2 top is completed, which would open the door for a multi-week rebound and potential target in the range 1353 - 1361.
The majority of the EW analysts are considering that price has completed an impulsive pattern. As you know I am quite skeptical of the impulsive option because in my opinion neither the down leg off the May 1 peak nor the last one from the May 29 lower high are impulsive.
For the short-term outcome, as you can see in the 15 min chart below, I cannot buy the idea of an important bottom if price has only unfolded a 3 -wave down leg from the May 29 peak:

This is why I suggested that price could be involved in unfolding an Ending Diagonal:

Another potential scenario could be a Triangle wave (B):

Therefore as long as price does not recover above the May 29 lower high at 1334.93 in my opinion the internal structure is suggesting that price will revisit last Monday's lod at 1266.74 and establish a new lower low.
With yesterday's huge rally we now have a daily White Marubozu. Some upside inertia usually follows this candlestick, but most of the time by eod it is a small range body.
Therefore we will have to wait for Friday's price action, in order to evaluate the bullish/bearish options.

I am going to monitor:
- KBE since a 2 days bounce does not guarantee that the corrective EWP, a potential Double Zig Zag, is over:

- DAX since in my opinion price has to unfold a wave (C) down in order to complete also a Double Zig Zag from the March 16 top. Here it remains to be seen if price will be able to recover above the 200 d MA.

- EUR since despite price has unfolded a complex EWP during mid February - end of April the down leg from the May 1 peak is not impulsive, therefore it cannot be considered completed. In addition the current bounce can only be considered as corrective. For the immediate time frame the key resistance is at 1.2622.

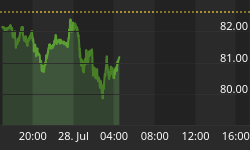
- VIX Has breached the Trend Line support.
Yesterday's candlestick does not give any confidence of a potential bottom. The next support is at the neckline of the Inverted H&S at 20.80.

On the technical front:
- Momentum:
We have the RSI at the trend line resistance.
A move above the 50 line will most likely kill the bearish options.
The MACD is at the critical level of a bullish confirmation / failure.

- The McClellan Oscillator is back above the zero line. Clearly this is a positive for the bulls.

Today the main focus will be FED Chairman Senate testimony.


