


Technical + Elliot Wave Analysis cannot predict with 100 % assurance future price action but it can be wisely used as a guide in choosing the most likely outcome.
I maintain the scenario, which calls that on June 4 price has established the bottom of the wave (A) of a larger potential Zig Zag from the April 2 top.
This EW option implies that price will unfold a 3 -wave pattern with two down legs. Therefore now price is involved with the counter trend wave (B) that will be followed by the second down leg wave (C).
A counter trend bounce usually is expected to top:
- Within Fibonacci range: 0.382% - 0.5% - 0.618% retracements of the wave (A).
- Time wise it should at least need 0.382% of the time to develop (of the wave (A)).
- In addition MA, gaps and trend lines must be taken into consideration as potential targets.
Therefore theoretically for SPX the assumed wave (B) target range is located in the range 1344.46 - 1362.84. In addition we have a gap that could be filled at 1353.39 while the 50 d MA which, today stands at 1353 and is pointing down, is the critical MA to be watched.

Additional weakness towards the 1292 area could shape a bullish Inverted H&S that has a theoretical target at 1404.
Critical levels:
- Below: 10 d MA = 1306; HS = 1300; HS = 1292; 200 d MA = 1290
- Above: HR = 1335. 52; 0.382 Ret. = 1344.46; Gap & 50 dMA = 1353.39; 0.5 Ret. = 1362.84
Time wise, during the last week of June price is expected to establish the top of the wave (B). Then a wave (C) down will most likely head towards the Trend Line support in force since the March 09 lows. Initially we can assign a projected 155 points drop.

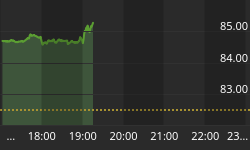
Short-Term price action:
So far price is involved in a consolidation phase with immediate support at the 10 d MA = 1306 and resistance at 1335.50
I would not rule out that price has not completed yet a corrective patter from last Monday's hod.
Therefore we could still have a pending wave (c) down with a target in the range 1301 - 1293.
If this is the case then the mentioned Inverted HS pattern could pan out although it remains to be seen if the 1404 target will be achieved, instead I would be looking at a potential 1 x 1 extension target of 68 points.


