


Four points for investors to ponder before Friday's employment report:
Point One: It is the market's reaction to the number that matters, not the number. Even if we had an advance copy of Friday's report, it would not be easy to predict the market's reaction. A good report on the labor front could be interpreted as bullish (economy better than expected) or bearish (the Fed will not print). A bad report could be interpreted as bullish (Fed prints) or bearish (economy on the rocks). A Yahoo Finance story takes the bullish view of a good report:
After back-to-back data disasters in April and May, the June Non-Farm Payroll report out tomorrow could bring investors some much needed relief. While economists, on average, are expecting a modest rebound to 100,000 new jobs created last month from 68,000 in May, some industry veterans think the final report of an otherwise awful second quarter will be a whole lot better than that, especially considering today's better-than-expected ADP Private Payroll report.
CNBC covered the "good" is "bad" angle:
May's dismal jobs report prompted immediate speculation of further easing by the Federal Reserve, and even though the Fed extended one program at its June meeting, the market is still looking for signs that it could do a third, larger scale "quantitative easing," or QE3 asset purchase program. "I think the whisper is closer to 110,000, 120,000," said John Briggs, senior Treasury strategist at RBS. "Anything between 80,000 and 130,000 doesn't matter. It shouldn't be a major market mover," he said. However, Briggs said the equity market is being supported by the idea of Fed easing and a really good number might actually be a negative to some in risk markets.
Point Two: The S&P 500 is clearly in an intermediate-term uptrend. The trend began four weeks ago. As of Thursday's close, the S&P 500 was above its 20-, 50-, 100-, and 200-day moving averages, which is indicative of favorable conditions for investors. The 50-day moving average is currently flat, indicating some indecision, but the slopes are positive on the 20-, 100-, and 200-day moving averages, which leans bullish until it changes. All trends have counter-trend rallies. The S&P 500 could drop 37 points on Friday and still remain above the bullish trendline from the June low near 1,330. As long as the S&P 500 remains above 1,330, we will view any pullback as a buying opportunity.

Point Three: The table and chart below were described in detail on June 21; updated versions are shown below. The pullback scenario, similar to points A (2010) and B (2011) in the chart below, remains viable in the present day. If and when the hurdles below are cleared, which could happen soon, it would increase the odds of stocks pushing higher in the near-term. For investors, if the Relative Strength Index (RSI) on the S&P 500's daily chart can close above 65 in the next few days, it would be another step in the bullish direction.


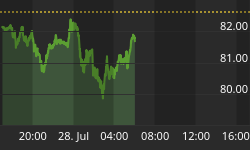
Point Four: Thursday's close was weak with RSI failing to retake 70 on the 60-minute chart below. It is far from earth-shattering, but it shows waning bullish interest in the very short-term. On a more positive note, the S&P 500's 5-, 10-, and 15-minute DeMark charts are close to getting "buy setups", which leaves a crack in the door for buyers early in Friday's session. DeMark indicators are proprietary tools from Market Studies, LLC.

A push above 1,375 on the S&P 500 would be a good step for the bulls on Friday, leaving us more open to redeploying additional cash. Below 1,375, the short-term risk-reward profile tells us to be patient; a better entry point may come somewhere between 1,363 and 1,330. A break of 1,330 would put the "visit to the June lows" scenario back on the probability table.


