


7/12/2012 9:05:56 AM
My view on the markets.
Markets are weak this am. That's good for us. What happens next is critical... What do I mean?
I see the markets as random. So in any day (or timeframe), they can move up, down or sideways. But what we do know is that the market generally makes 4 types of moves. Normal Sine Wave, Up Trend, Down Trend, and Consolidation. Each of these moves has a number of characteristics (numeric).
And historically, meaning every year, markets tend to go through these various types of move. It's very easy to figure out in hindsight. But it's not so easy to predict the future. Let's say there's 7 of the first 3 types of moves, and up to 7 of the last type of move. You never know.
So when I built the barometer, the premise is that you don't know the future, but you DO know that these certain moves occur periodically each year. And you also know that those moves have certain characteristics. And only somme of the moves are profitable. And you also know that the most profitable moves are in the first 3 types of moves.
So the barometer positions for every move as if it's going to be a profitable move. Over time, that's what makes it profitable. It doesn't try to predict what's going to happen. It's a fixed system, in a variable, random market.
I liken to a baseball batter, who swings at every pitch as if it was a fast ball right down the middle. The picther can throw a curve, slider, changeup or fastball. But when the pitcher throws a fastball - it's a homerun. In our case it's even better, because we can hit on 3 of 4 of the pitches...
And what would make it more difficult for the batter is if he tried to predict the pitch. Now he's varying between 4 variations from him, and the pitcher. That leads to 16 possible variations. I like the odds more with only 4 variations and knowing if I have 1, it will work...
Point is, you never know what the market is going to do. But if you do the same thing every time (fixed), over time, you'll be more right, than wrong. At least that's my experience.
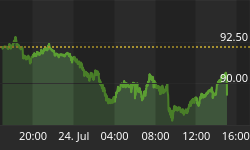
Now we start talking about normal sine wave markets. We're at a point where we've been in a normal (to consolidation) type market. Not the best for our system, but that's life. The market could break out of this normal consolidation and that's where we'll profit. Look at this chart:

The market is on the verge of going from a normal/consolidation type move to a trending move lower, which should take it out a farther on the distribution curve.
That's good for us...
Here's a look at the global markets:

On the economic front, here is the schedule for this week. Pay close attention to the timing of the report and the potential for the markets to make short term reversals at those points.
On to the charts:

Stock Barometer Analysis
We remain in Sell Mode looking for the markets to move lower for the rest of this month.
The Stock Barometer is my proprietary market timing system. The direction, slope and level of the Stock Barometer determine our outlook. For example, if the barometer line is moving down, we are in Sell Mode. A Buy or Sell Signal is triggered when the indicator clearly changes direction. Trend and support can override the barometer signals.
Money Management & Stops
To trade this system, there are a few things you need to know and address to control your risk:
• This system targets intermediate term moves, of which even in the best years, there are usually only up to 7 profitable intermediate term moves. The rest of the year will be consolidating moves where this system will experience small losses and gains that offset each other.
• This system will usually result in losing trades more than 50% of the time, even in our best years. The key is being positioned properly for longer term moves when they come.
• Therefore it is vitally important that you apply some form of money management to protect your capital.
• Trading a leveraged index fund will result in more risk, since you cannot set stops and you cannot get out intraday.
Accordingly;
• Make sure you set your stops so that you can lose no more than 2% per trade (based on the QQQQ if you're trading leveraged funds and options with our trading service).
Potential Cycle Reversal Dates
2012 Potential Reversal Dates: 1/12, 1/27, 2/16, 2/23, 3/16, 4/9, 4/25, 5/26. 6/2, 6/15, 7/2, 7/25. These dates have an accuracy of +/- 2 days. We publish dates up to 2 months in advance.
If this is 'the' top, we're looking for the markets to move lower into the end of July.
Our IRG Market Timing and Sentiment data service shows the performance of these forecast turn dates going back to 2003 and for the remainder of 2012.
My Additional timing work is based on numerous cycles and has resulted in the above potential reversal dates. These are not to be confused with the barometer signals or cycle times. However, due to their past accuracy I post the dates here.
Timing Indicators
Use the following Timing/momentum indicators to assist in your trading of the QQQQ, GLD, USD, USO and TLT. They are tuned to deliver signals in line with the Stock Barometer and we use them only in determining our overall outlook for the market and for pinpointing market reversals. The level, direction, and position to the zero line are keys in these indicators. For example, direction determines mode and a buy signal 'above zero' is more bullish than a buy signal 'below zero'.
QQQ Timing Indicator (NASDAQ:QQQ)

The QQQQ Spread Indicator will yield its own buy and sell signals that may be different from the Stock Barometer. It's meant to give us an idea of the next turn in the market.
Gold Timing Indicator (ARCX:GLD)

Want to trade Gold? Use our signals with the Gold ETF AMEX:GLD. Gold gives us a general gage to the overall health of the US Economy and the markets.
US Dollar Index Timing Indicator (INDEX:DXY)

Want to trade the US Dollar? Use our signals with the Power Shares AMEX:UUP: US Dollar Index Bullish Fund and AMEX:UDN: US Dollar Index Bearish Fund.
Bonds Timing Indicator (AMEX:TLT)

Want to trade Bonds? Use our signals with Lehman?s 20 year ETF AMEX:TLT. The direction of bonds has an impact on the stock market. Normally, as bonds go down, stocks will go up and as bonds go up, stocks will go down.
OIL Timing Indicator (AMEX:USO)

Want to trade OIL? Use our signals with AMEX:USO, the OIL ETF. We look at the price of oil as its level and direction has an impact on the stock market.
Secondary Stock Market Timing Indicator

We maintain hundreds of popular and proprietary technical indicators that break down market internals, sentiment and money flow to give YOU unique insight into whether you should BUY or SELL the market. We feature at least one here each day in support of our current outlook.
As a subscriber to the Daily Stock Barometer System, you also get access to all our charts and research. Email Customer Support at stockbarometer@gmail.com to upgrade your subscription.
Daily Stock Market Outlook
We remain in Sell Mode, looking for the markets to move lower into July 25th.
The above chart shows me how VIX Traders are positioning. In my world, this positioning creates energy (or lack thereof) in the market. That energy has to play out. Traders are positioning for a large move higher in the VIX. Which is lowering my expectations for downside. Although, even though up to 90% of the time at extremes they're wrong - sometimes they're right.
With Fed minutes on Wednesday - I tend to see the more telling move the day following. As firms have time to digest the news, and reposition their algorithms accordingly. Remember, most of the market is computer traded. Computers don't read the news. But they are programmed by humans. Sometimes math guys. Worse yet, economists... That's where most systems fail.
Speaking on futures, the S&P futures broke an uptrend. The Nasdaq futures are right there on their uptrend (as of this writing) I expect them to fail.
This could be a very large day move lower. As the market moves out of the 'normal' range, volatility will increase. This will define the next range.
On Gold, I continue to be bearish. I'm still calling for a large move lower in gold. I'm in the minority. I like being in the minority. It's how I make a living...
Here's our current positioning.
- Last Recommendation - 7/11 - SHORT QQQ
- Status - The beginning of every trade is the most riskiest. Practice proper money management.
- Consideration - Maintain stop per money management above.
If you want to learn more about some of my models and indicators, I use my blog to cover them in more detail. If you're looking for more information, please visit our blog - I'll have updates and publish other articles there. http://investmentresearchgroup.com/Blog/
Regards,


