


The iShares China 25 ETF (FXI) remains 26% below its 2010 high, leaving the door open to a possibly attractive opportunity to "buy low". As we noted late in Thursday's session, the short-term risk-reward ratio for most risk assets is unfavorable. Therefore, some patience may be in order relative to considering all new positions, including China. Like the United States and Europe, growth in China is slowing, which has prompted speculation that stimulus is on the way. From BusinessWeek:
"The government may use measures other than interest rates to boost the economy," said Wei Wei, an analyst at West China Securities Co. in Shanghai. "There are some company earnings that are quite bad." China's Premier Wen Jiabao will probably decide to cut banks' reserve requirements and encourage corporate lending as the cabinet meets to discuss efforts to revive economic growth, the swap market indicates. The Shanghai Composite has fallen 11 percent from this year's high recorded on March 2 as two interest-rate cuts failed to assuage concerns that earnings growth will slow. The measure is valued at 9.7 times estimated profit, compared with the 17.5 average since Bloomberg began compiling the data in 2006.
From a technical perspective, FXI is trying to flip from a negative trend (red lines below) over to a positive trend (green lines). A formal trend change would be established if FXI clears 40, but we have seen enough to at least put China on our watch list. The chart below is a weekly chart going back to 2010.

The Chinese economy expanded 7.6 percent last quarter, which represents the slowest pace of growth in more than three years. From Gulf News:
China has "relatively large" room to boost fiscal spending to spur growth, Zhang Peng, a researcher with the Fiscal Research Institute at the Ministry of Finance in Beijing, said yesterday in an interview. China needs to adopt a "moderately easing" policy when growth is below 8 percent, the Shanghai Securities News reported on Thursday, citing Fan Jianping, chief economist at the State Information Centre.
As shown below, FXI has cleared two important moving averages on its daily chart. The green arrows show a higher high; the blue arrows highlight a higher low, which is indicative of a possible bullish turn. Downside momentum, or the desire to sell, has weakened as FXI was moving sideways from late May to late June. The waning bearish momentum can be seen in the slopes of lines B and C. We recently purchased crude oil based on similar divergences shown in early July.

Similar potentially bullish divergences appear on the chart below tracking China's performance relative to the S&P 500 Index. The slopes of lines B and C below tell us to be open to a rally in Chinese stocks.

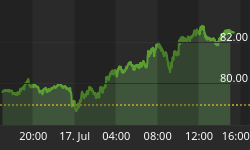
FXI's 60-minute chart was a little extended at the close on Thursday. Therefore, some weakness in the next day or so would not be surprising. We would like to see any FXI pullback remain above 32.59


