


On June 7th, 2012, the price of gold dropped by $22 in less than a second, guided by a computer algorithm during late trading
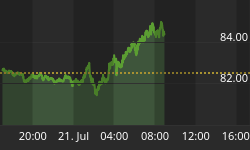
Sharp price drops in gold, for example $10 within a few minutes, can be observed frequently. Often they occur several times per week. The decline that happened on June 7, 2012 looks, at first glance, like such a drop as well, although some observers immediately noticed the extremely high speed. Market reports assessed the timeframe from "43 seconds" to "less than 5 minutes". According to spot price data with minute precision, the decrease was $20 in less than 2 minutes. The intraday chart below shows the price development in the spot market on June 7, 2012. The relevant decline is marked in red.
Gold often drops sharply within a few minutes for no obvious reason. It did so on June 7, when the decline during late trading was very fast.

Fig 1.
A High Frequency Attack
However, what took place in the late evening hours of June 7th on the futures market is of a wholly different quality. As part of the CME Group, COMEX is the largest exchange for gold futures contracts. The exchange records each single trade with the exact time, price and quantity. These records are called Times & Sales report and are available from the CME. They reveal for June 7, 2012 for the period of one second, namely at 9:21 PM and 20 seconds CDT, a complex price attack in the high frequency range which can be performed only by especially programmed computers.
During that one second 501 prices were determined, among them 490 with volume, while during all other 3599 seconds of this trading hour on average only 1.87 trades per second were registered. In this once second the number of trades suddenly rose 260-fold! Figure 2 shows an excerpt of the Times & Sales report with the start of the relevant second for the most active August contract.
The future exchange provides Times & Sales reports with all trades. At 21:21 (9:21 PM) there was one trade in each of the seconds 16 - 19. However, in second 20 a total of 501 quotes were registered. The first of which was already pointing downwards.

Fig. 2, Source: CME
Investigation of the Exchange's Records
The left column shows the trade time with a resolution of one second. Next to it, the figure lists the price, the volume and where applicable additional information (such as cancel). During the first seconds, we can see a low trading activity with one trade per second. This is normal for this period late in the evening. Then the high frequency attack started. Please consider that the excerpt below only shows the first seven of a total of 490 trades of the second 21:21:20. Faster than a machine gun, one trade after another is executed in milliseconds or faster. The excerpt shows that the price dropped already $3.7 at the start of the relevant second. The many small trades also demonstrate that the reason for this activity was not just a large misplaced order. But during this one second more oddities occurred. Figure 3 shows another excerpt from the Times & Sales report of the relevant second.
During second 20, a series of sharp drops took place in the range of milliseconds. The example shows a drop of 8.3, down from 1578.1 to 1569.8.

Fig. 3, Source: CME
Flash Drops within Milliseconds...
The excerpt starts with two trades at $1578 and a small rise to $1578.1. But then the price abruptly drops by $8.3! As quick as a flash, one trade after another is executed at this much lower price of $1569.8 with the volume of only one contract. We notice significantly lower prices appear in the most active contract within milliseconds. Actually one would expect that there were many trades in between due to limited buy orders being in the market. As the price sank, there was no execution all the way down the 83 steps of $0.1 each. But then there were eight trades at once at $1569.8 with a volume of exactly one. It seems as if the trades have been shot under the buy limits of other market participants.
...Followed by Recoveries
However, this low shot is not an isolated case. Sudden drops of at least $7 without a price in between appeared five times in the relevant second. In addition there were several smaller declines. But the prices recovered almost always completely in between! Thus there are apparently some buy orders. This rapid up and down appears as if the other market participants awakened from milliseconds of sleep, then placed their orders, only to fall right back into another millisecond nap. In reality, however, a high frequency computer program was active which generated a large number of individual trades to manipulate the price.
The Attack's Second in Detail
Now we look closely at the second 21:21:20. The figure below shows all the prices in the relevant second, an Intra-Second Chart, so to speak. As is common, the vertical axis indicates the price in dollars per ounce. On the horizontal axis the trades during that second are sequentially numbered. In addition, the prices before and after are shown, and so-called indicative prices (in red).
The almost 500 trades of second 20: Clearly visible are many sharp drops, followed by recoveries. These movements happened in fractions of a second.

Fig. 4, Data source: CME
High Frequency Up & Down
We can clearly see the up and down of the prices. Neither a mistrade, nor a move in the spot market, nor a building up of several high frequency programs (like in the flash crash of the stock market on 6 May, 2010) can cause such swings. In addition, the hundredfold increased number of trades and volume can eliminate such causes. Also the spot market can't be the cause in question, as it lagged behind the sharp drop. Instead it was a phenomenon of the futures market. Generally, no person but only a high frequency computer program can act so fast. Due to the lack of any suitable alternative, its purpose must have been price manipulation. Indeed it was achieved: the price stayed more than $20 lower for hours - time enough to get back the costs of the operation.
The Trading System of the Exchange
At this point a look at the trading system of the CME is merited. Due to the conspicuous price movements, the CME halted trading on 7 June 2012 already during second 21:21:20 for 40 seconds by a program called Stop Spike Logic. This also means that the 500 price movements took place in less than a second! While this reaction of the trading system makes sense, other procedures are questionable. For instance so called indicative prices should appear only when no trading takes place (indicative prices are estimates where supply and demand would meet). However, the Times & Sales report shows indicative prices during trading even before the halt (see Figure 4). These prices stood repeatedly at $1556 or about $22 lower than in the second before. At the same time this was already the level at which trading should start again after the halt. The CME was not able or not willing to explain how this could happen despite repeated inquiry and detailed explanations of the facts. For the sake of completeness, it should be noted that at this point there were no news for the gold market and that other markets such as currencies, bonds or stocks showed no significant price movements (except of silver).
Conclusion
High frequency programs which now account for a significant share of trading activity have rightly fallen into disrepute in recent times. They might be useful in some cases such as avoiding market impact while placing large orders. However, unequal access to the market is questionable as are highly technical efforts which are ultimately done only to pull money out of the pockets of slower market participants. At the very latest, limits of legality are touched when high frequency programs are used for front running or to manipulate prices. Such a price manipulation took place on June 7, 2012, at 9:21 PM and 20 seconds in form of a high frequency attack on gold. One second was enough to manipulate the price of gold down by more than one per cent for the duration of several hours. Although in the past central banks repeatedly intervened in the gold market, it is unlikely that this action was done by a central bank. In the field of high frequency trading, the technical complexity and the necessary level of experience and specialization are probably too high. Therefore, a private financial institution must have done the high frequency price manipulation to achieve a trading profit. This was a well-defined incident in thin trading, limited to a short time period and to a single market. These conditions make it ideal for a successful investigation by the regulatory authorities.


