


MARKET TOP FORMING?
Precision timing for all time frames through a multi-dimensional approach to technical
analysis: Cycles - Breadth - P&F and Fibonacci price projections
and occasional Elliott Wave analysis
"By the Law of Periodical Repetition, everything which has happened once must happen again, and again, and again -- and not capriciously, but at regular periods, and each thing in its own period, not another's, and each obeying its own law... The same Nature which delights in periodical repetition in the sky is the Nature which orders the affairs of the earth. Let us not underrate the value of that hint." ~ Mark Twain
Current Position of the Market
SPX: Very Long-term trend - The very-long-term cycles are down and, if they make their lows when expected (after this bull market is over) there will be another steep and prolonged decline into late 2014. It is probable, however, that the steep correction of 2007-2009 will have curtailed the full downward pressure potential of the 120-yr cycle.
SPX: Intermediate trend - SPX is in a limited intermediate uptrend which is estimated to end in the first week of August.
Analysis of the short-term trend is done on a daily basis with the help of hourly charts. It is an important adjunct to the analysis of daily and weekly charts which discusses the course of longer market trends.
Market Overview
Ever since the SPX started its uptrend from 1267, I projected that the rally would end at about 1404. That was a target derived from a Point & Figure count taken across the base and confirmed by a Fibonacci measurement. While this is a preferred count, it is not an absolute, and there is a valid count to 1425 and some even higher. Last Tuesday, the index rose to 1407 before backing off and spending the rest of the week moving sideways in what could turn out to be a pattern of distribution -- which would put an end to the rally, resulting in a subsequent decline, or one of re-accumulation, with an eventual break-out to the upside followed by higher prices.
Next week should determine what path the market wants to follow over the near-term. Taking into consideration the cyclic configuration, the odds favor an end to the rally sometime this month, with a preference for the first part of August. Friday's price action was caused by a minor cycle bottoming in the first hour which initiated a bounce into the close. Although that looks like the start of a move to higher highs, some important indices did not participate, bringing into question whether this was simply a test of the highs. On the other hand, XIV made a new high while the market did not -- action which is potentially bullish (but not infallible). This is why we need to wait for Monday to clarify the market's intention.
Whether or not we are ready for an intermediate correction, the odds of this being a major top which would put an end to the bull market are not great. During this uptrend, the weekly indicators of the SPX had a bullish move to the top of their range and are now overbought, a condition from which they normally correct, but not one from which they start a major decline. On the other hand, the NDX weekly indicators are less bullish and are beginning to show negative divergence.
Overall, the near-term picture is a little blurry and we need to wait for some clarification. Let's look at the charts.
Chart analysis
We'll start, once again, by analyzing the Daily SPX with the McClellan oscillator placed underneath it.
The momentum indicator turned down, showing some negative divergence to its last top while the SPX made a new high. The McClellan oscillator is even worse, showing little inclination to move away from the zero line. With the market going sideways for most of the week, the chart is not very different from that of a week ago, but the slight changes are negative.
That does not mean that we'll get an immediate sell-off. The only thing that counts, in the long run, is when the price starts to come down, breaking trend lines and support levels. We are not quite at that stage, yet, but it could come quickly if our expectation that important cycles are topping is correct.


The Hourly Chart of the SPX would not have told us much more than the daily chart, so we turn to the Russell 2000 ETF for another perspective. That index peaked in early July as opposed to the SPX which continued to make new highs. If we were to look at a weekly chart, we would see that NDX actually peaked in April 2011, diverging significantly from SPX at the April 2012 high, and diverging even more today. This is regarded as a negative since small cap stocks have historically led the market in both directions. It would also be another indication that longer and shorter-term weakness is settling into the market.
For those who think that Friday's move represents a resumption of the uptrend, look at the performance of UWM on Friday! Where is the rally? I could show you other indices that performed in the same manner, making Friday's "strength" questionable.
Let's see what happens on Monday. For a continuation of the rally we need to see some good buying appear at the opening.

Cycles
With weekly and longer term cycles topping in August, this month was expected to bring about an end to the rally which started at 1267 on 6/04. While the early part of the month was favored, the topping formation could stretch for a little while longer.
Breadth
Below is the NYSI (Summation Index, courtesy of StockCharts.com). The initial downturn in the index has been averted and it is trying to move back in an uptrend. The next time it rolls over should start a decline in the market. All eyes on the A/D over the next few days! It should determine whether the market is ready to sell off, or if more time is required.
The focus should be on the hourly indicator. It has been correcting from an overbought position as the market moved sideways. It ended the week just about neutral, but looking as if it was trying to turn up as a result of Friday's market action. Monday's opening should determine whether or not the near-term correction is over.

Sentiment Indicator
The XIV (inverted volatility index)
The SentimenTrader is not saying much, so we'll turn to the XIV which is more sensitive in predicting market turns. It is here portrayed beneath the SPX (courtesy of Qchats) for an easier comparison.

XIV turned bearish during the month of July, seemingly confirming the anticipated high in August. Until last Tuesday, the action was neutral, but for the rest of the week, it turned bullish. You can see that while SPX was flat, XIV continued its uptrend. This index is not infallible, but it has a good record of providing negative divergence at a top and it is definitely not doing so at this time. That would suggest that SPX is not through going up.
XLF (Financial SPDR)
While XIV is giving us a bullish near-term picture, XLF could be said to be doing the opposite, similar to the Russell 2000 -- although it is not quite as bearish over the short-term. For sure, like the other indices, it is only suggesting that a top may be forming at this time, and it will take more time to determine if this is the case. The trend line which has to be broken in order to begin a significant decline is still far below and more topping action would probably be required before this takes place.

BONDS
After contradicting the uptrend in equity markets for several weeks, TLT finally relented and started to correct after making a new high. It has now retraced to the level where it found good support earlier -- around 125. We'll see if it can maintain that level or needs to continue its correction.
The long-term trend is not jeopardized at this time, but if it breaks this level, it could continue to correct back to an intermediate trend line around 120, which is also the current level of its 200-DMA and should provide good support. Although it has re-bounded from 124 back to 126, it will have to prove that it can hold this level before it can resume its uptrend.

UUP (Dollar ETF) Daily Chart
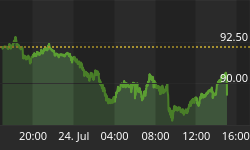
Like TLT, UUP is also in a long-term uptrend, and like TLT also in a short-term consolidation. It is not as dynamic an uptrend as that of TLT, but it does have a fairly clear-cut projection of 25, toward which it seems to be moving steadily. That would correspond to about 90 on the USD.

UUP is much more susceptible to the vagaries of the Euro than TLT, and the Euro's future is still full of uncertainties. Short-term, the possibility of some action being taken by the ECB in September could have some positive effect on the Euro, if it materializes. That would be a short-term negative for the dollar.
GLD (ETF for gold)
Gold has been in an intermediate-term correction which, after almost a year, is threatening to become a long-term decline. It is not a particularly aggressive downtrend since it has now held the 149 level since last December. But it has been stuck in a 10-point range - primarily limited on the upside by its 200-DMA -- for about three months and can't seem to get out of it. Even if it managed to break out on the upside, it would still have to overcome its long-term downtrend line which is about 5 points higher from where it is currently trading.
Since the 25-wk cycle is in its early phase, it has a chance of moving higher if it can overcome the 200-DMA. But something will have to trigger that move, and if the dollar continues to rally, it will not help matters. Nothing much will happen until GLD either moves above 159 or below 149.

FXE (Euro Trust ETF)
We know that the moves in the Euro have an effect on the market. As of now, the euro is in a long-term downtrend and trading approximately in the middle of its downtrend channel. It found support on an inside parallel line and has been in a weak uptrend since. Meeting resistance from a previous low, it backed off right away but remains in an uptrend.
It is unlikely that FXE will have a significant up-move in the near future, but it could have a quick upside response to the ECB if something positive comes out of its September meeting. Should this happen, the P&F chart suggests that it could quickly move up to about 124.50.
The near-term is bullish since it has broken out of a short-term downtrend line and is currently back-testing it. The daily momentum oscillator is bullish and the hourly oversold, a positive technical condition.

OIL (USO)
We have not looked at oil for a couple of weeks, so let's see what it's doing. Below is a daily chart of the index which shows that it is in a short-term uptrend since finding support at 29 -- the level of a previous low in October of last year. This put an end to a steep 13 point decline and represents a recovery from this severe sell-off.
While one might be tempted to see this as a double-bottom from which USO could start another uptrend, that thinking would be premature. The index would have to do a lot more work and show some real strength before confirming a double-bottom. The current rally consists of a non-impulsive 5-wave pattern which has almost retraced 50% of its last decline. That could mean that this rally is nearly over.
Consider also these other factors: 1) 36 is the projection which is given to this move by the P&F chart. 2) at 36, it runs into resistance which goes back to February 2011. 3) 36 is also the current level of the 200-DMA, and 4) If, by some miracle, it were able to get above 36, it would immediately run into the long-term downtrend line from its 2008 top. No, I don't think that this index has much of an upside potential, while the downside is still considerable if it breaks below 29.

Summary
The SPX may be starting to create a distribution pattern which, when complete, would turn out to be at least a short-term top, and perhaps an intermediate one as well.
Intermediate-term cycles appear to be topping in this area, with early August being the favorite time frame for a reversal, but with the third week in August also being a candidate.
The daily chart indicators are beginning to show deceleration and divergence, but prices are still not in immediate danger of breaking trend lines. We'll need to see some substantial weakness in the A/D before prices can be pulled down into a significant decline.
FREE TRIAL SUBSCRIPTON
Market Turning Points is a service which is uncommonly dependable and reasonably priced providing intra-day market updates with comments and explanations, plus a daily summary and a weekly report. My service is ideally suited to traders, but it is also valuable to longer-term holders since price projections are provided using Point & Figure analysis, along with best-time estimates obtained from cycle analysis.
For a FREE 4-week trial, Send an email to: ajg@cybertrails.com
For further subscription options, payment plans, and for important general information, I encourage you to visit my website at www.marketurningpoints.com.


