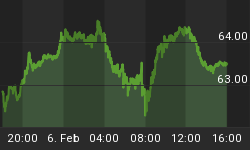
Wednesday's move up in gold was huge. Not so much in terms of points gained -- although it was a pretty chunky rally -- but more in terms of context.

There is almost no risk now that this is a false breakout, which could have led to a very quick collapse back down. There is always such risk at critical breakouts, and even though I didn't see much of a problem with this set-up, you can just never be 100% certain that the opposite energy won't come flooding in to tank a good-looking breakout move.
In the short-term, gold is in "all-or-nothing" mode where sharp bursts of upside energy are punctuated by sideways periods.

This is a great pattern, actually, for this stage of a budding move, and it should lead to more gains in the days immediately ahead. This pattern is re-energizing quickly after the bursts higher, which is the perfect short-term pattern to support a full 11-day trend right here.
Checking the daily fractal dimension (first chart above) confirms that there is still plenty of available energy to power a sizeable 11-day rally. But the best news of all is the fractal dimension readings on the weekly and monthly charts.


There is a monstrous amount of energy available to power a massive trend in gold. This is an ideal set-up for a move up to the next 21-month peak, scheduled to arrive in June or July 2013. In fact, if gold just behaves as it has throughout this long bull market -- nothing special or out-of-the-ordinary required -- then the expected target range for this 21-month peak is $2,500 to $2,800, with the potential for a short-term overreaction up to just under $3,000.
This is a sample issue of the daily Fractal Gold Report. For a 30-day free trial, which includes a bonus subscription to our daily report on equity markets, please follow this link.


